Immigrants from Dominica vs Immigrants from Belarus In Labor Force | Age 20-64
COMPARE
Immigrants from Dominica
Immigrants from Belarus
In Labor Force | Age 20-64
In Labor Force | Age 20-64 Comparison
Immigrants from Dominica
Immigrants from Belarus
78.1%
IN LABOR FORCE | AGE 20-64
0.0/ 100
METRIC RATING
280th/ 347
METRIC RANK
80.1%
IN LABOR FORCE | AGE 20-64
96.4/ 100
METRIC RATING
93rd/ 347
METRIC RANK
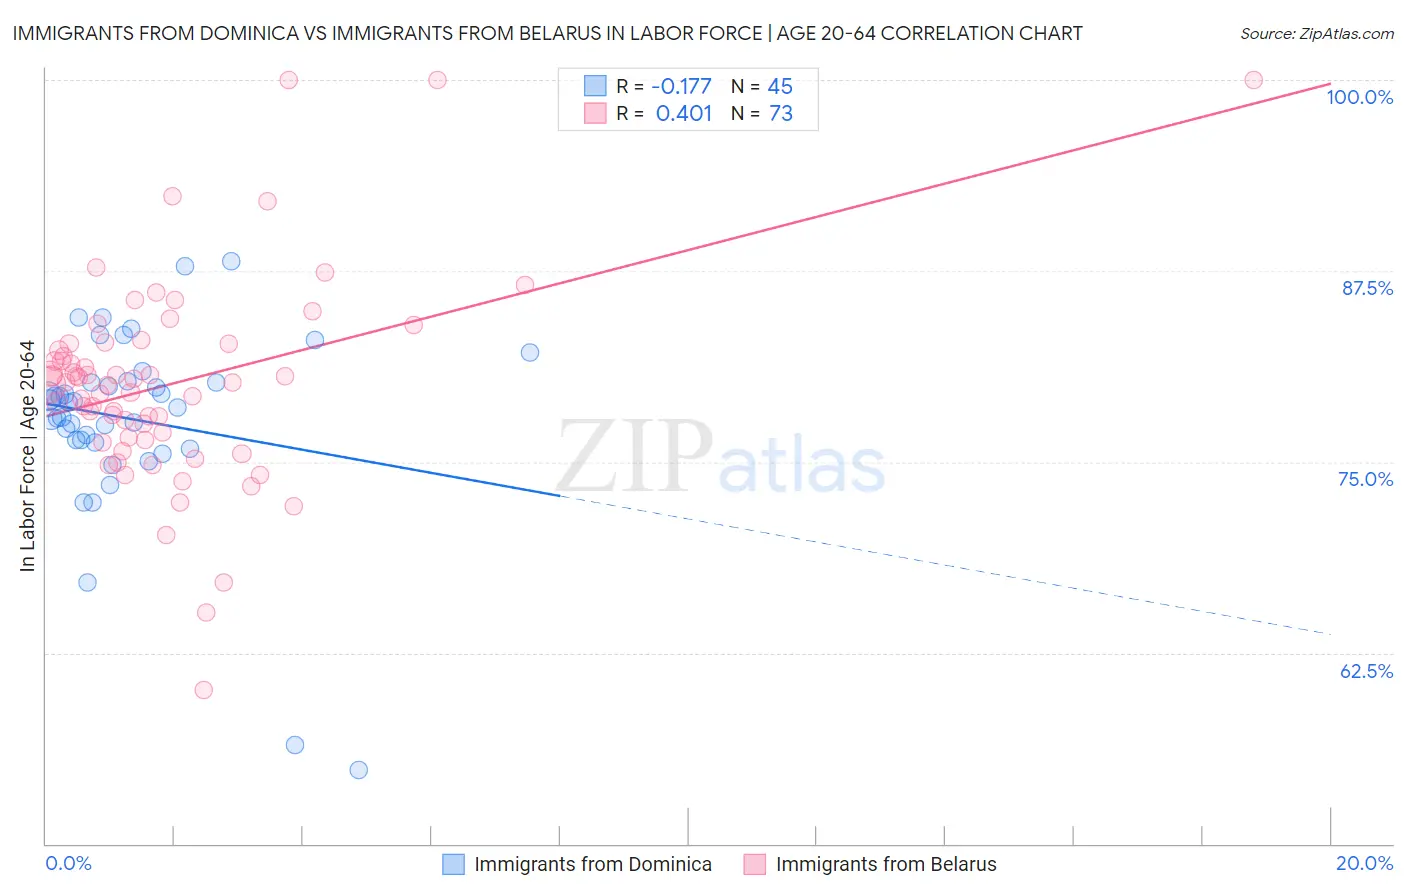
Immigrants from Dominica vs Immigrants from Belarus In Labor Force | Age 20-64 Correlation Chart
The statistical analysis conducted on geographies consisting of 83,787,194 people shows a poor negative correlation between the proportion of Immigrants from Dominica and labor force participation rate among population between the ages 20 and 64 in the United States with a correlation coefficient (R) of -0.177 and weighted average of 78.1%. Similarly, the statistical analysis conducted on geographies consisting of 150,198,984 people shows a moderate positive correlation between the proportion of Immigrants from Belarus and labor force participation rate among population between the ages 20 and 64 in the United States with a correlation coefficient (R) of 0.401 and weighted average of 80.1%, a difference of 2.5%.
In Labor Force | Age 20-64 Correlation Summary
| Measurement | Immigrants from Dominica | Immigrants from Belarus |
| Minimum | 54.8% | 60.1% |
| Maximum | 88.1% | 100.0% |
| Range | 33.3% | 39.9% |
| Mean | 77.8% | 80.1% |
| Median | 78.9% | 80.2% |
| Interquartile 25% (IQ1) | 76.4% | 76.5% |
| Interquartile 75% (IQ3) | 80.3% | 82.7% |
| Interquartile Range (IQR) | 3.9% | 6.2% |
| Standard Deviation (Sample) | 6.2% | 6.7% |
| Standard Deviation (Population) | 6.1% | 6.7% |
Similar Demographics by In Labor Force | Age 20-64
Demographics Similar to Immigrants from Dominica by In Labor Force | Age 20-64
In terms of in labor force | age 20-64, the demographic groups most similar to Immigrants from Dominica are Guyanese (78.1%, a difference of 0.030%), Belizean (78.2%, a difference of 0.040%), Immigrants from St. Vincent and the Grenadines (78.1%, a difference of 0.050%), Nonimmigrants (78.1%, a difference of 0.060%), and Immigrants from Guyana (78.1%, a difference of 0.080%).
| Demographics | Rating | Rank | In Labor Force | Age 20-64 |
| French American Indians | 0.0 /100 | #273 | Tragic 78.2% |
| Aleuts | 0.0 /100 | #274 | Tragic 78.2% |
| Spanish | 0.0 /100 | #275 | Tragic 78.2% |
| Puget Sound Salish | 0.0 /100 | #276 | Tragic 78.2% |
| Immigrants | Bahamas | 0.0 /100 | #277 | Tragic 78.2% |
| Mexican American Indians | 0.0 /100 | #278 | Tragic 78.2% |
| Belizeans | 0.0 /100 | #279 | Tragic 78.2% |
| Immigrants | Dominica | 0.0 /100 | #280 | Tragic 78.1% |
| Guyanese | 0.0 /100 | #281 | Tragic 78.1% |
| Immigrants | St. Vincent and the Grenadines | 0.0 /100 | #282 | Tragic 78.1% |
| Immigrants | Nonimmigrants | 0.0 /100 | #283 | Tragic 78.1% |
| Immigrants | Guyana | 0.0 /100 | #284 | Tragic 78.1% |
| Osage | 0.0 /100 | #285 | Tragic 78.0% |
| Immigrants | Belize | 0.0 /100 | #286 | Tragic 78.0% |
| Vietnamese | 0.0 /100 | #287 | Tragic 78.0% |
Demographics Similar to Immigrants from Belarus by In Labor Force | Age 20-64
In terms of in labor force | age 20-64, the demographic groups most similar to Immigrants from Belarus are Polish (80.1%, a difference of 0.020%), Uruguayan (80.1%, a difference of 0.020%), Ghanaian (80.1%, a difference of 0.020%), Immigrants from Asia (80.1%, a difference of 0.020%), and Yugoslavian (80.1%, a difference of 0.020%).
| Demographics | Rating | Rank | In Labor Force | Age 20-64 |
| Immigrants | Egypt | 97.1 /100 | #86 | Exceptional 80.1% |
| Croatians | 97.1 /100 | #87 | Exceptional 80.1% |
| Chileans | 97.0 /100 | #88 | Exceptional 80.1% |
| Immigrants | Venezuela | 96.8 /100 | #89 | Exceptional 80.1% |
| Poles | 96.8 /100 | #90 | Exceptional 80.1% |
| Uruguayans | 96.7 /100 | #91 | Exceptional 80.1% |
| Ghanaians | 96.7 /100 | #92 | Exceptional 80.1% |
| Immigrants | Belarus | 96.4 /100 | #93 | Exceptional 80.1% |
| Immigrants | Asia | 96.0 /100 | #94 | Exceptional 80.1% |
| Yugoslavians | 95.9 /100 | #95 | Exceptional 80.1% |
| Immigrants | Malaysia | 95.9 /100 | #96 | Exceptional 80.1% |
| South Americans | 95.9 /100 | #97 | Exceptional 80.1% |
| Immigrants | Uruguay | 95.8 /100 | #98 | Exceptional 80.1% |
| Immigrants | Chile | 95.7 /100 | #99 | Exceptional 80.1% |
| Filipinos | 95.6 /100 | #100 | Exceptional 80.1% |