Immigrants from Ireland vs Immigrants from Belarus In Labor Force | Age 20-64
COMPARE
Immigrants from Ireland
Immigrants from Belarus
In Labor Force | Age 20-64
In Labor Force | Age 20-64 Comparison
Immigrants from Ireland
Immigrants from Belarus
80.7%
IN LABOR FORCE | AGE 20-64
99.9/ 100
METRIC RATING
32nd/ 347
METRIC RANK
80.1%
IN LABOR FORCE | AGE 20-64
96.4/ 100
METRIC RATING
93rd/ 347
METRIC RANK
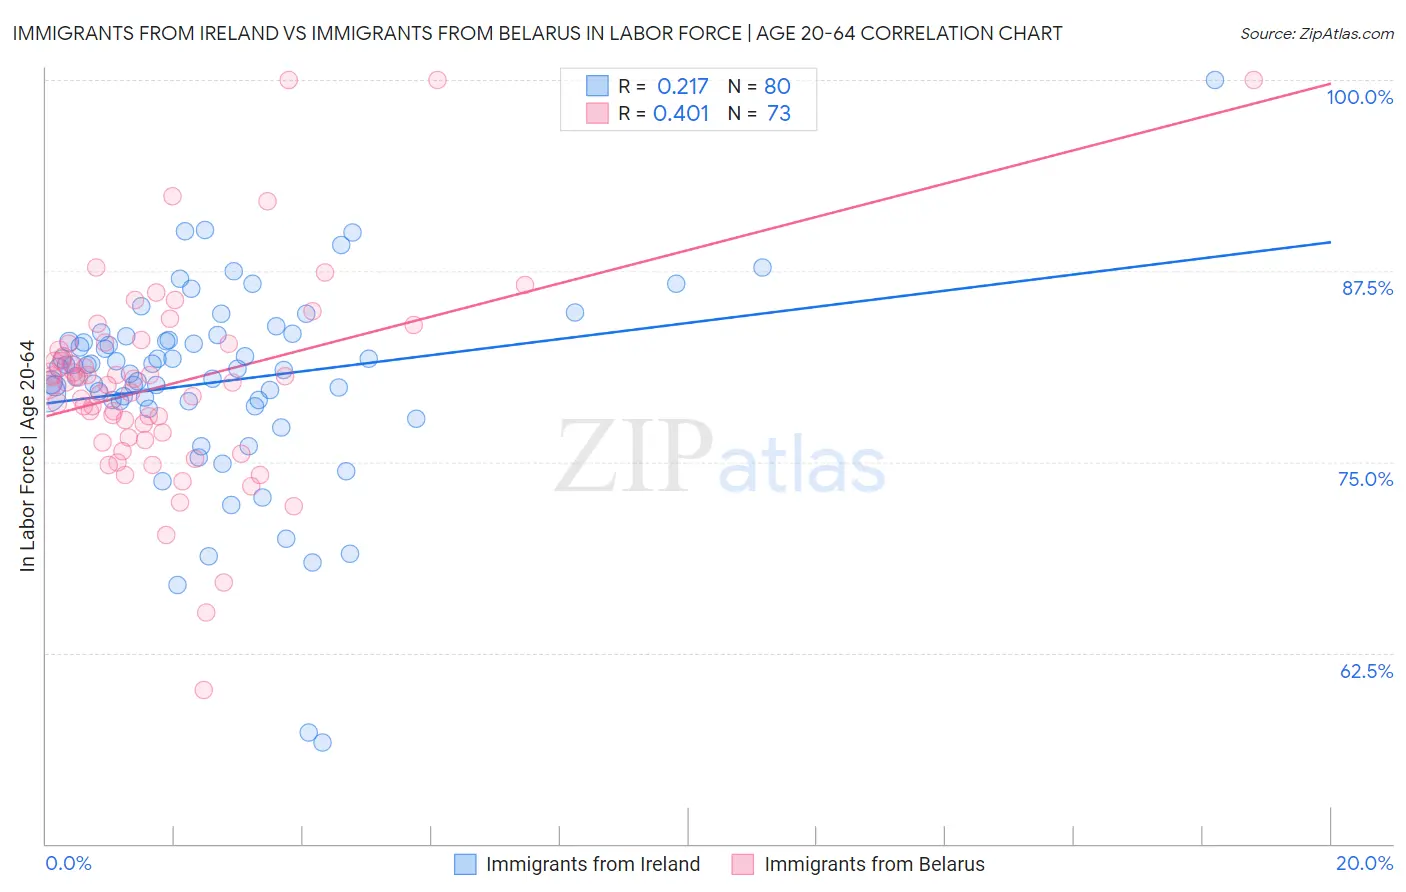
Immigrants from Ireland vs Immigrants from Belarus In Labor Force | Age 20-64 Correlation Chart
The statistical analysis conducted on geographies consisting of 240,784,168 people shows a weak positive correlation between the proportion of Immigrants from Ireland and labor force participation rate among population between the ages 20 and 64 in the United States with a correlation coefficient (R) of 0.217 and weighted average of 80.7%. Similarly, the statistical analysis conducted on geographies consisting of 150,198,984 people shows a moderate positive correlation between the proportion of Immigrants from Belarus and labor force participation rate among population between the ages 20 and 64 in the United States with a correlation coefficient (R) of 0.401 and weighted average of 80.1%, a difference of 0.77%.
In Labor Force | Age 20-64 Correlation Summary
| Measurement | Immigrants from Ireland | Immigrants from Belarus |
| Minimum | 56.6% | 60.1% |
| Maximum | 100.0% | 100.0% |
| Range | 43.4% | 39.9% |
| Mean | 80.3% | 80.1% |
| Median | 81.1% | 80.2% |
| Interquartile 25% (IQ1) | 79.0% | 76.5% |
| Interquartile 75% (IQ3) | 83.1% | 82.7% |
| Interquartile Range (IQR) | 4.1% | 6.2% |
| Standard Deviation (Sample) | 6.5% | 6.7% |
| Standard Deviation (Population) | 6.4% | 6.7% |
Similar Demographics by In Labor Force | Age 20-64
Demographics Similar to Immigrants from Ireland by In Labor Force | Age 20-64
In terms of in labor force | age 20-64, the demographic groups most similar to Immigrants from Ireland are Immigrants from Lithuania (80.7%, a difference of 0.010%), Immigrants from South Central Asia (80.7%, a difference of 0.030%), Immigrants from North Macedonia (80.7%, a difference of 0.030%), Chinese (80.7%, a difference of 0.030%), and Immigrants from Uganda (80.7%, a difference of 0.050%).
| Demographics | Rating | Rank | In Labor Force | Age 20-64 |
| Kenyans | 100.0 /100 | #25 | Exceptional 80.8% |
| Immigrants | Serbia | 100.0 /100 | #26 | Exceptional 80.8% |
| Immigrants | Kenya | 99.9 /100 | #27 | Exceptional 80.7% |
| Immigrants | Uganda | 99.9 /100 | #28 | Exceptional 80.7% |
| Immigrants | South Central Asia | 99.9 /100 | #29 | Exceptional 80.7% |
| Immigrants | North Macedonia | 99.9 /100 | #30 | Exceptional 80.7% |
| Immigrants | Lithuania | 99.9 /100 | #31 | Exceptional 80.7% |
| Immigrants | Ireland | 99.9 /100 | #32 | Exceptional 80.7% |
| Chinese | 99.9 /100 | #33 | Exceptional 80.7% |
| Immigrants | Brazil | 99.9 /100 | #34 | Exceptional 80.7% |
| Immigrants | Poland | 99.9 /100 | #35 | Exceptional 80.6% |
| Paraguayans | 99.8 /100 | #36 | Exceptional 80.6% |
| Immigrants | Moldova | 99.8 /100 | #37 | Exceptional 80.6% |
| Ugandans | 99.8 /100 | #38 | Exceptional 80.6% |
| Brazilians | 99.8 /100 | #39 | Exceptional 80.5% |
Demographics Similar to Immigrants from Belarus by In Labor Force | Age 20-64
In terms of in labor force | age 20-64, the demographic groups most similar to Immigrants from Belarus are Polish (80.1%, a difference of 0.020%), Uruguayan (80.1%, a difference of 0.020%), Ghanaian (80.1%, a difference of 0.020%), Immigrants from Asia (80.1%, a difference of 0.020%), and Yugoslavian (80.1%, a difference of 0.020%).
| Demographics | Rating | Rank | In Labor Force | Age 20-64 |
| Immigrants | Egypt | 97.1 /100 | #86 | Exceptional 80.1% |
| Croatians | 97.1 /100 | #87 | Exceptional 80.1% |
| Chileans | 97.0 /100 | #88 | Exceptional 80.1% |
| Immigrants | Venezuela | 96.8 /100 | #89 | Exceptional 80.1% |
| Poles | 96.8 /100 | #90 | Exceptional 80.1% |
| Uruguayans | 96.7 /100 | #91 | Exceptional 80.1% |
| Ghanaians | 96.7 /100 | #92 | Exceptional 80.1% |
| Immigrants | Belarus | 96.4 /100 | #93 | Exceptional 80.1% |
| Immigrants | Asia | 96.0 /100 | #94 | Exceptional 80.1% |
| Yugoslavians | 95.9 /100 | #95 | Exceptional 80.1% |
| Immigrants | Malaysia | 95.9 /100 | #96 | Exceptional 80.1% |
| South Americans | 95.9 /100 | #97 | Exceptional 80.1% |
| Immigrants | Uruguay | 95.8 /100 | #98 | Exceptional 80.1% |
| Immigrants | Chile | 95.7 /100 | #99 | Exceptional 80.1% |
| Filipinos | 95.6 /100 | #100 | Exceptional 80.1% |