Serbian vs Immigrants from Belarus In Labor Force | Age 20-64
COMPARE
Serbian
Immigrants from Belarus
In Labor Force | Age 20-64
In Labor Force | Age 20-64 Comparison
Serbians
Immigrants from Belarus
80.3%
IN LABOR FORCE | AGE 20-64
98.9/ 100
METRIC RATING
58th/ 347
METRIC RANK
80.1%
IN LABOR FORCE | AGE 20-64
96.4/ 100
METRIC RATING
93rd/ 347
METRIC RANK
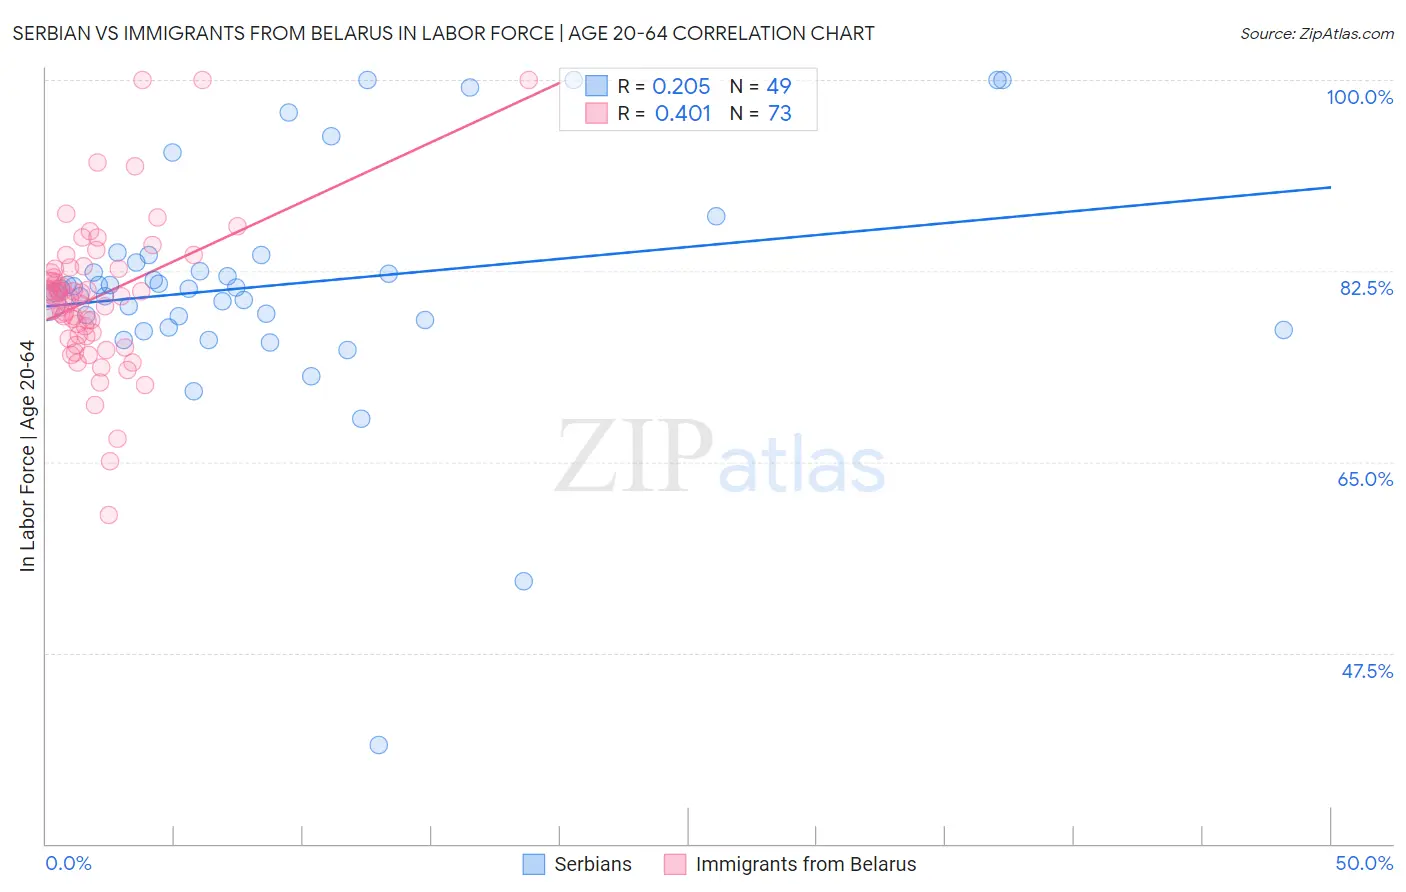
Serbian vs Immigrants from Belarus In Labor Force | Age 20-64 Correlation Chart
The statistical analysis conducted on geographies consisting of 267,654,798 people shows a weak positive correlation between the proportion of Serbians and labor force participation rate among population between the ages 20 and 64 in the United States with a correlation coefficient (R) of 0.205 and weighted average of 80.3%. Similarly, the statistical analysis conducted on geographies consisting of 150,198,984 people shows a moderate positive correlation between the proportion of Immigrants from Belarus and labor force participation rate among population between the ages 20 and 64 in the United States with a correlation coefficient (R) of 0.401 and weighted average of 80.1%, a difference of 0.24%.
In Labor Force | Age 20-64 Correlation Summary
| Measurement | Serbian | Immigrants from Belarus |
| Minimum | 39.1% | 60.1% |
| Maximum | 100.0% | 100.0% |
| Range | 60.9% | 39.9% |
| Mean | 81.2% | 80.1% |
| Median | 80.9% | 80.2% |
| Interquartile 25% (IQ1) | 77.7% | 76.5% |
| Interquartile 75% (IQ3) | 83.6% | 82.7% |
| Interquartile Range (IQR) | 6.0% | 6.2% |
| Standard Deviation (Sample) | 10.6% | 6.7% |
| Standard Deviation (Population) | 10.5% | 6.7% |
Similar Demographics by In Labor Force | Age 20-64
Demographics Similar to Serbians by In Labor Force | Age 20-64
In terms of in labor force | age 20-64, the demographic groups most similar to Serbians are Swedish (80.3%, a difference of 0.0%), Immigrants from Northern Africa (80.3%, a difference of 0.010%), Afghan (80.3%, a difference of 0.010%), Tongan (80.3%, a difference of 0.010%), and Burmese (80.3%, a difference of 0.010%).
| Demographics | Rating | Rank | In Labor Force | Age 20-64 |
| Immigrants | Sri Lanka | 99.3 /100 | #51 | Exceptional 80.4% |
| Turks | 99.2 /100 | #52 | Exceptional 80.3% |
| Immigrants | Peru | 99.2 /100 | #53 | Exceptional 80.3% |
| Peruvians | 99.1 /100 | #54 | Exceptional 80.3% |
| Immigrants | Cabo Verde | 99.0 /100 | #55 | Exceptional 80.3% |
| Immigrants | Northern Africa | 99.0 /100 | #56 | Exceptional 80.3% |
| Afghans | 98.9 /100 | #57 | Exceptional 80.3% |
| Serbians | 98.9 /100 | #58 | Exceptional 80.3% |
| Swedes | 98.9 /100 | #59 | Exceptional 80.3% |
| Tongans | 98.8 /100 | #60 | Exceptional 80.3% |
| Burmese | 98.8 /100 | #61 | Exceptional 80.3% |
| Carpatho Rusyns | 98.8 /100 | #62 | Exceptional 80.3% |
| Immigrants | Korea | 98.8 /100 | #63 | Exceptional 80.3% |
| Immigrants | Albania | 98.7 /100 | #64 | Exceptional 80.3% |
| Lithuanians | 98.7 /100 | #65 | Exceptional 80.2% |
Demographics Similar to Immigrants from Belarus by In Labor Force | Age 20-64
In terms of in labor force | age 20-64, the demographic groups most similar to Immigrants from Belarus are Polish (80.1%, a difference of 0.020%), Uruguayan (80.1%, a difference of 0.020%), Ghanaian (80.1%, a difference of 0.020%), Immigrants from Asia (80.1%, a difference of 0.020%), and Yugoslavian (80.1%, a difference of 0.020%).
| Demographics | Rating | Rank | In Labor Force | Age 20-64 |
| Immigrants | Egypt | 97.1 /100 | #86 | Exceptional 80.1% |
| Croatians | 97.1 /100 | #87 | Exceptional 80.1% |
| Chileans | 97.0 /100 | #88 | Exceptional 80.1% |
| Immigrants | Venezuela | 96.8 /100 | #89 | Exceptional 80.1% |
| Poles | 96.8 /100 | #90 | Exceptional 80.1% |
| Uruguayans | 96.7 /100 | #91 | Exceptional 80.1% |
| Ghanaians | 96.7 /100 | #92 | Exceptional 80.1% |
| Immigrants | Belarus | 96.4 /100 | #93 | Exceptional 80.1% |
| Immigrants | Asia | 96.0 /100 | #94 | Exceptional 80.1% |
| Yugoslavians | 95.9 /100 | #95 | Exceptional 80.1% |
| Immigrants | Malaysia | 95.9 /100 | #96 | Exceptional 80.1% |
| South Americans | 95.9 /100 | #97 | Exceptional 80.1% |
| Immigrants | Uruguay | 95.8 /100 | #98 | Exceptional 80.1% |
| Immigrants | Chile | 95.7 /100 | #99 | Exceptional 80.1% |
| Filipinos | 95.6 /100 | #100 | Exceptional 80.1% |