Assyrian/Chaldean/Syriac vs Bhutanese In Labor Force | Age 16-19
COMPARE
Assyrian/Chaldean/Syriac
Bhutanese
In Labor Force | Age 16-19
In Labor Force | Age 16-19 Comparison
Assyrians/Chaldeans/Syriacs
Bhutanese
38.3%
IN LABOR FORCE | AGE 16-19
97.8/ 100
METRIC RATING
119th/ 347
METRIC RANK
36.3%
IN LABOR FORCE | AGE 16-19
35.3/ 100
METRIC RATING
185th/ 347
METRIC RANK
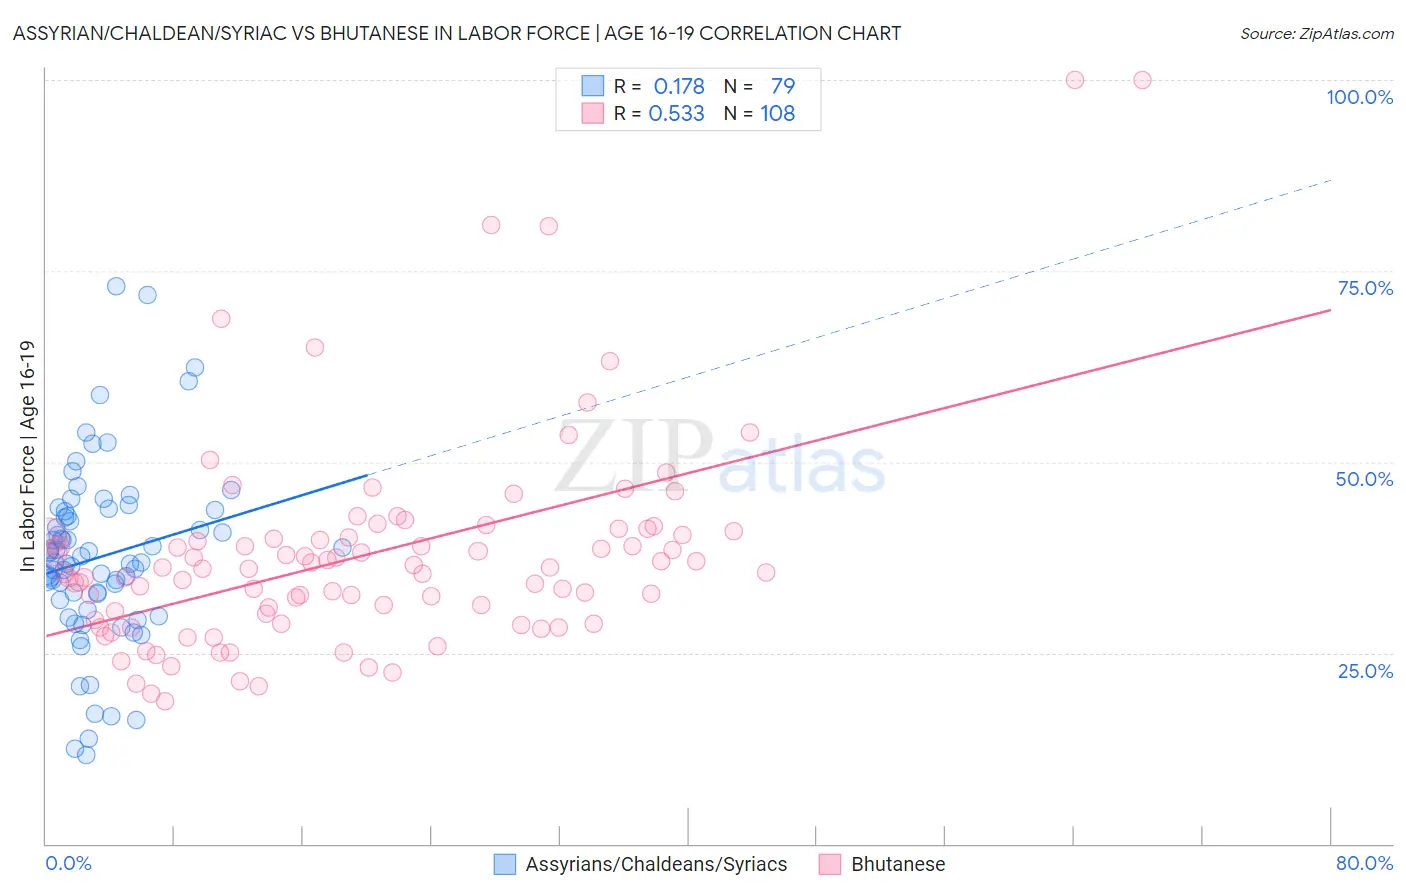
Assyrian/Chaldean/Syriac vs Bhutanese In Labor Force | Age 16-19 Correlation Chart
The statistical analysis conducted on geographies consisting of 110,301,649 people shows a poor positive correlation between the proportion of Assyrians/Chaldeans/Syriacs and labor force participation rate among population between the ages 16 and 19 in the United States with a correlation coefficient (R) of 0.178 and weighted average of 38.3%. Similarly, the statistical analysis conducted on geographies consisting of 454,665,515 people shows a substantial positive correlation between the proportion of Bhutanese and labor force participation rate among population between the ages 16 and 19 in the United States with a correlation coefficient (R) of 0.533 and weighted average of 36.3%, a difference of 5.6%.
In Labor Force | Age 16-19 Correlation Summary
| Measurement | Assyrian/Chaldean/Syriac | Bhutanese |
| Minimum | 11.7% | 18.6% |
| Maximum | 73.0% | 100.0% |
| Range | 61.3% | 81.4% |
| Mean | 37.5% | 37.8% |
| Median | 36.8% | 36.0% |
| Interquartile 25% (IQ1) | 31.8% | 29.8% |
| Interquartile 75% (IQ3) | 43.5% | 40.4% |
| Interquartile Range (IQR) | 11.7% | 10.6% |
| Standard Deviation (Sample) | 11.6% | 13.9% |
| Standard Deviation (Population) | 11.6% | 13.8% |
Similar Demographics by In Labor Force | Age 16-19
Demographics Similar to Assyrians/Chaldeans/Syriacs by In Labor Force | Age 16-19
In terms of in labor force | age 16-19, the demographic groups most similar to Assyrians/Chaldeans/Syriacs are Immigrants from Nepal (38.3%, a difference of 0.020%), Chickasaw (38.3%, a difference of 0.030%), Bulgarian (38.3%, a difference of 0.080%), Colville (38.3%, a difference of 0.080%), and Ukrainian (38.3%, a difference of 0.090%).
| Demographics | Rating | Rank | In Labor Force | Age 16-19 |
| Immigrants | Scotland | 98.5 /100 | #112 | Exceptional 38.5% |
| Sub-Saharan Africans | 98.3 /100 | #113 | Exceptional 38.4% |
| Hawaiians | 98.2 /100 | #114 | Exceptional 38.4% |
| Bulgarians | 97.9 /100 | #115 | Exceptional 38.3% |
| Colville | 97.9 /100 | #116 | Exceptional 38.3% |
| Chickasaw | 97.8 /100 | #117 | Exceptional 38.3% |
| Immigrants | Nepal | 97.8 /100 | #118 | Exceptional 38.3% |
| Assyrians/Chaldeans/Syriacs | 97.8 /100 | #119 | Exceptional 38.3% |
| Ukrainians | 97.6 /100 | #120 | Exceptional 38.3% |
| Ethiopians | 97.4 /100 | #121 | Exceptional 38.2% |
| Guamanians/Chamorros | 97.4 /100 | #122 | Exceptional 38.2% |
| Seminole | 96.7 /100 | #123 | Exceptional 38.1% |
| Immigrants | England | 96.4 /100 | #124 | Exceptional 38.1% |
| Immigrants | Africa | 96.1 /100 | #125 | Exceptional 38.0% |
| Africans | 95.6 /100 | #126 | Exceptional 38.0% |
Demographics Similar to Bhutanese by In Labor Force | Age 16-19
In terms of in labor force | age 16-19, the demographic groups most similar to Bhutanese are Costa Rican (36.3%, a difference of 0.040%), Immigrants from Romania (36.3%, a difference of 0.070%), Immigrants from Afghanistan (36.3%, a difference of 0.080%), Eastern European (36.4%, a difference of 0.19%), and Immigrants from Europe (36.2%, a difference of 0.20%).
| Demographics | Rating | Rank | In Labor Force | Age 16-19 |
| Blacks/African Americans | 45.1 /100 | #178 | Average 36.5% |
| Immigrants | Southern Europe | 43.3 /100 | #179 | Average 36.4% |
| Immigrants | Morocco | 41.1 /100 | #180 | Average 36.4% |
| Jordanians | 39.6 /100 | #181 | Fair 36.4% |
| Immigrants | Italy | 39.1 /100 | #182 | Fair 36.4% |
| Eastern Europeans | 38.8 /100 | #183 | Fair 36.4% |
| Costa Ricans | 36.1 /100 | #184 | Fair 36.3% |
| Bhutanese | 35.3 /100 | #185 | Fair 36.3% |
| Immigrants | Romania | 34.0 /100 | #186 | Fair 36.3% |
| Immigrants | Afghanistan | 34.0 /100 | #187 | Fair 36.3% |
| Immigrants | Europe | 31.8 /100 | #188 | Fair 36.2% |
| Immigrants | Hungary | 28.8 /100 | #189 | Fair 36.2% |
| Panamanians | 28.6 /100 | #190 | Fair 36.1% |
| Immigrants | Croatia | 27.5 /100 | #191 | Fair 36.1% |
| Afghans | 25.7 /100 | #192 | Fair 36.1% |