Assyrian/Chaldean/Syriac vs Blackfeet In Labor Force | Age 16-19
COMPARE
Assyrian/Chaldean/Syriac
Blackfeet
In Labor Force | Age 16-19
In Labor Force | Age 16-19 Comparison
Assyrians/Chaldeans/Syriacs
Blackfeet
38.3%
IN LABOR FORCE | AGE 16-19
97.8/ 100
METRIC RATING
119th/ 347
METRIC RANK
38.9%
IN LABOR FORCE | AGE 16-19
99.4/ 100
METRIC RATING
93rd/ 347
METRIC RANK
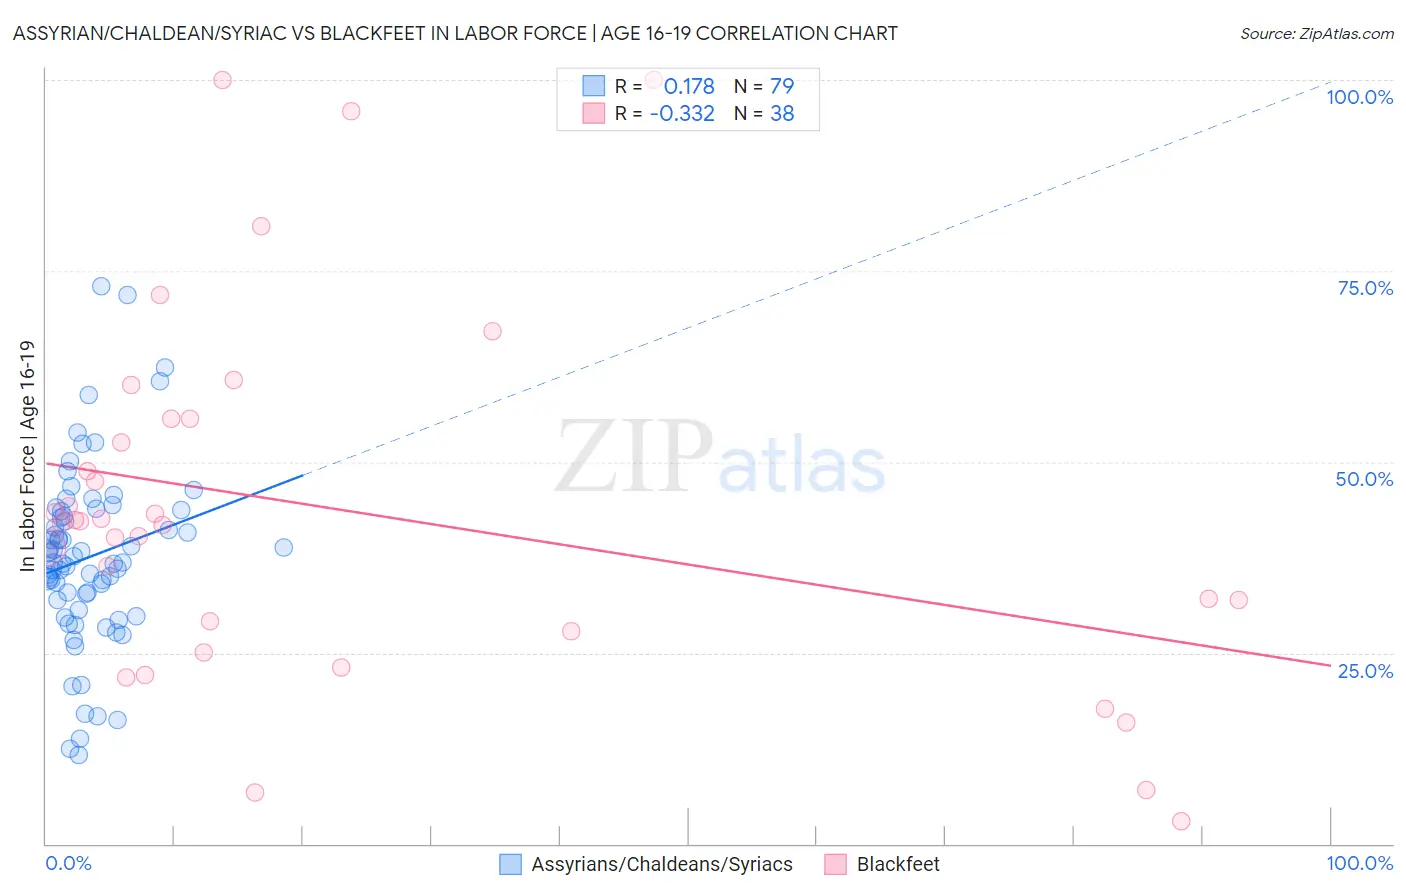
Assyrian/Chaldean/Syriac vs Blackfeet In Labor Force | Age 16-19 Correlation Chart
The statistical analysis conducted on geographies consisting of 110,301,649 people shows a poor positive correlation between the proportion of Assyrians/Chaldeans/Syriacs and labor force participation rate among population between the ages 16 and 19 in the United States with a correlation coefficient (R) of 0.178 and weighted average of 38.3%. Similarly, the statistical analysis conducted on geographies consisting of 309,138,575 people shows a mild negative correlation between the proportion of Blackfeet and labor force participation rate among population between the ages 16 and 19 in the United States with a correlation coefficient (R) of -0.332 and weighted average of 38.9%, a difference of 1.6%.
In Labor Force | Age 16-19 Correlation Summary
| Measurement | Assyrian/Chaldean/Syriac | Blackfeet |
| Minimum | 11.7% | 2.9% |
| Maximum | 73.0% | 100.0% |
| Range | 61.3% | 97.1% |
| Mean | 37.5% | 43.6% |
| Median | 36.8% | 42.1% |
| Interquartile 25% (IQ1) | 31.8% | 27.8% |
| Interquartile 75% (IQ3) | 43.5% | 55.7% |
| Interquartile Range (IQR) | 11.7% | 27.9% |
| Standard Deviation (Sample) | 11.6% | 23.9% |
| Standard Deviation (Population) | 11.6% | 23.6% |
Similar Demographics by In Labor Force | Age 16-19
Demographics Similar to Assyrians/Chaldeans/Syriacs by In Labor Force | Age 16-19
In terms of in labor force | age 16-19, the demographic groups most similar to Assyrians/Chaldeans/Syriacs are Immigrants from Nepal (38.3%, a difference of 0.020%), Chickasaw (38.3%, a difference of 0.030%), Bulgarian (38.3%, a difference of 0.080%), Colville (38.3%, a difference of 0.080%), and Ukrainian (38.3%, a difference of 0.090%).
| Demographics | Rating | Rank | In Labor Force | Age 16-19 |
| Immigrants | Scotland | 98.5 /100 | #112 | Exceptional 38.5% |
| Sub-Saharan Africans | 98.3 /100 | #113 | Exceptional 38.4% |
| Hawaiians | 98.2 /100 | #114 | Exceptional 38.4% |
| Bulgarians | 97.9 /100 | #115 | Exceptional 38.3% |
| Colville | 97.9 /100 | #116 | Exceptional 38.3% |
| Chickasaw | 97.8 /100 | #117 | Exceptional 38.3% |
| Immigrants | Nepal | 97.8 /100 | #118 | Exceptional 38.3% |
| Assyrians/Chaldeans/Syriacs | 97.8 /100 | #119 | Exceptional 38.3% |
| Ukrainians | 97.6 /100 | #120 | Exceptional 38.3% |
| Ethiopians | 97.4 /100 | #121 | Exceptional 38.2% |
| Guamanians/Chamorros | 97.4 /100 | #122 | Exceptional 38.2% |
| Seminole | 96.7 /100 | #123 | Exceptional 38.1% |
| Immigrants | England | 96.4 /100 | #124 | Exceptional 38.1% |
| Immigrants | Africa | 96.1 /100 | #125 | Exceptional 38.0% |
| Africans | 95.6 /100 | #126 | Exceptional 38.0% |
Demographics Similar to Blackfeet by In Labor Force | Age 16-19
In terms of in labor force | age 16-19, the demographic groups most similar to Blackfeet are Immigrants from Canada (38.9%, a difference of 0.010%), Osage (39.0%, a difference of 0.060%), Immigrants from North America (38.9%, a difference of 0.090%), Latvian (38.9%, a difference of 0.13%), and Spanish American (39.0%, a difference of 0.15%).
| Demographics | Rating | Rank | In Labor Force | Age 16-19 |
| Samoans | 99.6 /100 | #86 | Exceptional 39.1% |
| Immigrants | Germany | 99.6 /100 | #87 | Exceptional 39.1% |
| Puget Sound Salish | 99.6 /100 | #88 | Exceptional 39.1% |
| Alaska Natives | 99.6 /100 | #89 | Exceptional 39.1% |
| Immigrants | Burma/Myanmar | 99.5 /100 | #90 | Exceptional 39.0% |
| Spanish Americans | 99.5 /100 | #91 | Exceptional 39.0% |
| Osage | 99.4 /100 | #92 | Exceptional 39.0% |
| Blackfeet | 99.4 /100 | #93 | Exceptional 38.9% |
| Immigrants | Canada | 99.4 /100 | #94 | Exceptional 38.9% |
| Immigrants | North America | 99.4 /100 | #95 | Exceptional 38.9% |
| Latvians | 99.4 /100 | #96 | Exceptional 38.9% |
| Greeks | 99.3 /100 | #97 | Exceptional 38.9% |
| Ugandans | 99.3 /100 | #98 | Exceptional 38.9% |
| Immigrants | North Macedonia | 99.3 /100 | #99 | Exceptional 38.9% |
| Immigrants | Thailand | 99.1 /100 | #100 | Exceptional 38.7% |