Assyrian/Chaldean/Syriac vs German Russian In Labor Force | Age 16-19

COMPARE

Assyrian/Chaldean/Syriac
Race
Ancestry
AfghanAfricanAlaska NativeAlaskan AthabascanAlbanianAleutAlsatianAmericanApacheArabArapahoArgentineanArmenianAssyrian/Chaldean/SyriacAustralianAustrianBahamianBangladeshiBarbadianBasqueBelgianBelizeanBermudanBhutaneseBlackfeetBolivianBrazilianBritishBritish West IndianBulgarianBurmeseCajunCambodianCanadianCape VerdeanCarpatho RusynCelticCentral AmericanCentral American IndianCherokeeCheyenneChickasawChileanChineseChippewaChoctawColombianColvilleComancheCosta RicanCreeCreekCroatianCrowCubanCypriotCzechCzechoslovakianDanishDelawareDominicanDutchDutch West IndianEastern EuropeanEcuadorianEgyptianEnglishEstonianEthiopianEuropeanFijianFilipinoFinnishFrenchFrench American IndianFrench CanadianGermanGhanaianGreekGuamanian/ChamorroGuatemalanGuyaneseHaitianHmongHonduranHopiHoumaHungarianIcelanderIndian (Asian)IndonesianInupiatIranianIraqiIrishIroquoisIsraeliItalianJamaicanJapaneseJordanianKenyanKiowaKoreanLaotianLatvianLebaneseLiberianLithuanianLumbeeLuxembourgerMacedonianMalaysianMalteseMarshalleseMenomineeMexicanMexican American IndianMongolianMoroccanNative HawaiianNavajoNepaleseNew ZealanderNicaraguanNigerianNorthern EuropeanNorwegianOkinawanOsageOttawaPaiutePakistaniPalestinianPanamanianParaguayanPennsylvania GermanPeruvianPimaPolishPortuguesePotawatomiPuebloPuerto RicanPuget Sound SalishRomanianRussianSalvadoranSamoanScandinavianScotch-IrishScottishSeminoleSenegaleseSerbianShoshoneSierra LeoneanSiouxSlavicSlovakSloveneSomaliSouth AfricanSouth AmericanSouth American IndianSoviet UnionSpaniardSpanishSpanish AmericanSpanish American IndianSri LankanSubsaharan AfricanSudaneseSwedishSwissSyrianTaiwaneseThaiTlingit-HaidaTohono O'OdhamTonganTrinidadian and TobagonianTsimshianTurkishU.S. Virgin IslanderUgandanUkrainianUruguayanUteVenezuelanVietnameseWelshWest IndianYakamaYaquiYugoslavianYumanYup'ikZimbabwean
Immigration
NonimmigrantsImmigrantsAfghanistanAfricaAlbaniaArgentinaArmeniaAsiaAustraliaAustriaBahamasBangladeshBarbadosBelarusBelgiumBelizeBoliviaBosnia and HerzegovinaBrazilBulgariaBurma/MyanmarCabo VerdeCambodiaCameroonCanadaCaribbeanCentral AmericaChileChinaColombiaCongoCosta RicaCroatiaCubaCzechoslovakiaDenmarkDominicaDominican RepublicEastern AfricaEastern AsiaEastern EuropeEcuadorEgyptEl SalvadorEnglandEritreaEthiopiaEuropeFijiFranceGermanyGhanaGreeceGrenadaGuatemalaGuyanaHaitiHondurasHong KongHungaryIndiaIndonesiaIranIraqIrelandIsraelItalyJamaicaJapanJordanKazakhstanKenyaKoreaKuwaitLaosLatin AmericaLatviaLebanonLiberiaLithuaniaMalaysiaMexicoMicronesiaMiddle AfricaMoldovaMoroccoNepalNetherlandsNicaraguaNigeriaNorth AmericaNorth MacedoniaNorthern AfricaNorthern EuropeNorwayOceaniaPakistanPanamaPeruPhilippinesPolandPortugalRomaniaRussiaSaudi ArabiaScotlandSenegalSerbiaSierra LeoneSingaporeSomaliaSouth AfricaSouth AmericaSouth Central AsiaSouth Eastern AsiaSouthern EuropeSpainSri LankaSt. Vincent and the GrenadinesSudanSwedenSwitzerlandSyriaTaiwanThailandTrinidad and TobagoTurkeyUgandaUkraineUruguayUzbekistanVenezuelaVietnamWest IndiesWestern AfricaWestern AsiaWestern EuropeYemenZaireZimbabweAzores
German Russian
Race
Ancestry
AfghanAfricanAlaska NativeAlaskan AthabascanAlbanianAleutAlsatianAmericanApacheArabArapahoArgentineanArmenianAustralianAustrianBahamianBangladeshiBarbadianBasqueBelgianBelizeanBermudanBhutaneseBlackfeetBolivianBrazilianBritishBritish West IndianBulgarianBurmeseCajunCambodianCanadianCape VerdeanCarpatho RusynCelticCentral AmericanCentral American IndianCherokeeCheyenneChickasawChileanChineseChippewaChoctawColombianColvilleComancheCosta RicanCreeCreekCroatianCrowCubanCypriotCzechCzechoslovakianDanishDelawareDominicanDutchDutch West IndianEastern EuropeanEcuadorianEgyptianEnglishEstonianEthiopianEuropeanFijianFilipinoFinnishFrenchFrench American IndianFrench CanadianGermanGerman RussianGhanaianGreekGuamanian/ChamorroGuatemalanGuyaneseHaitianHmongHonduranHopiHoumaHungarianIcelanderIndian (Asian)IndonesianInupiatIranianIraqiIrishIroquoisIsraeliItalianJamaicanJapaneseJordanianKenyanKiowaKoreanLaotianLatvianLebaneseLiberianLithuanianLumbeeLuxembourgerMacedonianMalaysianMalteseMarshalleseMenomineeMexicanMexican American IndianMongolianMoroccanNative HawaiianNavajoNepaleseNew ZealanderNicaraguanNigerianNorthern EuropeanNorwegianOkinawanOsageOttawaPaiutePakistaniPalestinianPanamanianParaguayanPennsylvania GermanPeruvianPimaPolishPortuguesePotawatomiPuebloPuerto RicanPuget Sound SalishRomanianRussianSalvadoranSamoanScandinavianScotch-IrishScottishSeminoleSenegaleseSerbianShoshoneSierra LeoneanSiouxSlavicSlovakSloveneSomaliSouth AfricanSouth AmericanSouth American IndianSoviet UnionSpaniardSpanishSpanish AmericanSpanish American IndianSri LankanSubsaharan AfricanSudaneseSwedishSwissSyrianTaiwaneseThaiTlingit-HaidaTohono O'OdhamTonganTrinidadian and TobagonianTsimshianTurkishU.S. Virgin IslanderUgandanUkrainianUruguayanUteVenezuelanVietnameseWelshWest IndianYakamaYaquiYugoslavianYumanYup'ikZimbabwean
Immigration
NonimmigrantsImmigrantsAfghanistanAfricaAlbaniaArgentinaArmeniaAsiaAustraliaAustriaBahamasBangladeshBarbadosBelarusBelgiumBelizeBoliviaBosnia and HerzegovinaBrazilBulgariaBurma/MyanmarCabo VerdeCambodiaCameroonCanadaCaribbeanCentral AmericaChileChinaColombiaCongoCosta RicaCroatiaCubaCzechoslovakiaDenmarkDominicaDominican RepublicEastern AfricaEastern AsiaEastern EuropeEcuadorEgyptEl SalvadorEnglandEritreaEthiopiaEuropeFijiFranceGermanyGhanaGreeceGrenadaGuatemalaGuyanaHaitiHondurasHong KongHungaryIndiaIndonesiaIranIraqIrelandIsraelItalyJamaicaJapanJordanKazakhstanKenyaKoreaKuwaitLaosLatin AmericaLatviaLebanonLiberiaLithuaniaMalaysiaMexicoMicronesiaMiddle AfricaMoldovaMoroccoNepalNetherlandsNicaraguaNigeriaNorth AmericaNorth MacedoniaNorthern AfricaNorthern EuropeNorwayOceaniaPakistanPanamaPeruPhilippinesPolandPortugalRomaniaRussiaSaudi ArabiaScotlandSenegalSerbiaSierra LeoneSingaporeSomaliaSouth AfricaSouth AmericaSouth Central AsiaSouth Eastern AsiaSouthern EuropeSpainSri LankaSt. Vincent and the GrenadinesSudanSwedenSwitzerlandSyriaTaiwanThailandTrinidad and TobagoTurkeyUgandaUkraineUruguayUzbekistanVenezuelaVietnamWest IndiesWestern AfricaWestern AsiaWestern EuropeYemenZaireZimbabweAzores
In Labor Force | Age 16-19
Income
Poverty
Unemployment
Labor Participation
Family Structure
Vehicle Availability
Education Level
Disability

In Labor Force | Age 16-19 Comparison

Assyrians/Chaldeans/Syriacs

German Russians

Exceptional
Exceptional
38.3%
IN LABOR FORCE | AGE 16-19
97.8/ 100
METRIC RATING
119th/ 347
METRIC RANK
42.4%
IN LABOR FORCE | AGE 16-19
100.0/ 100
METRIC RATING
25th/ 347
METRIC RANK

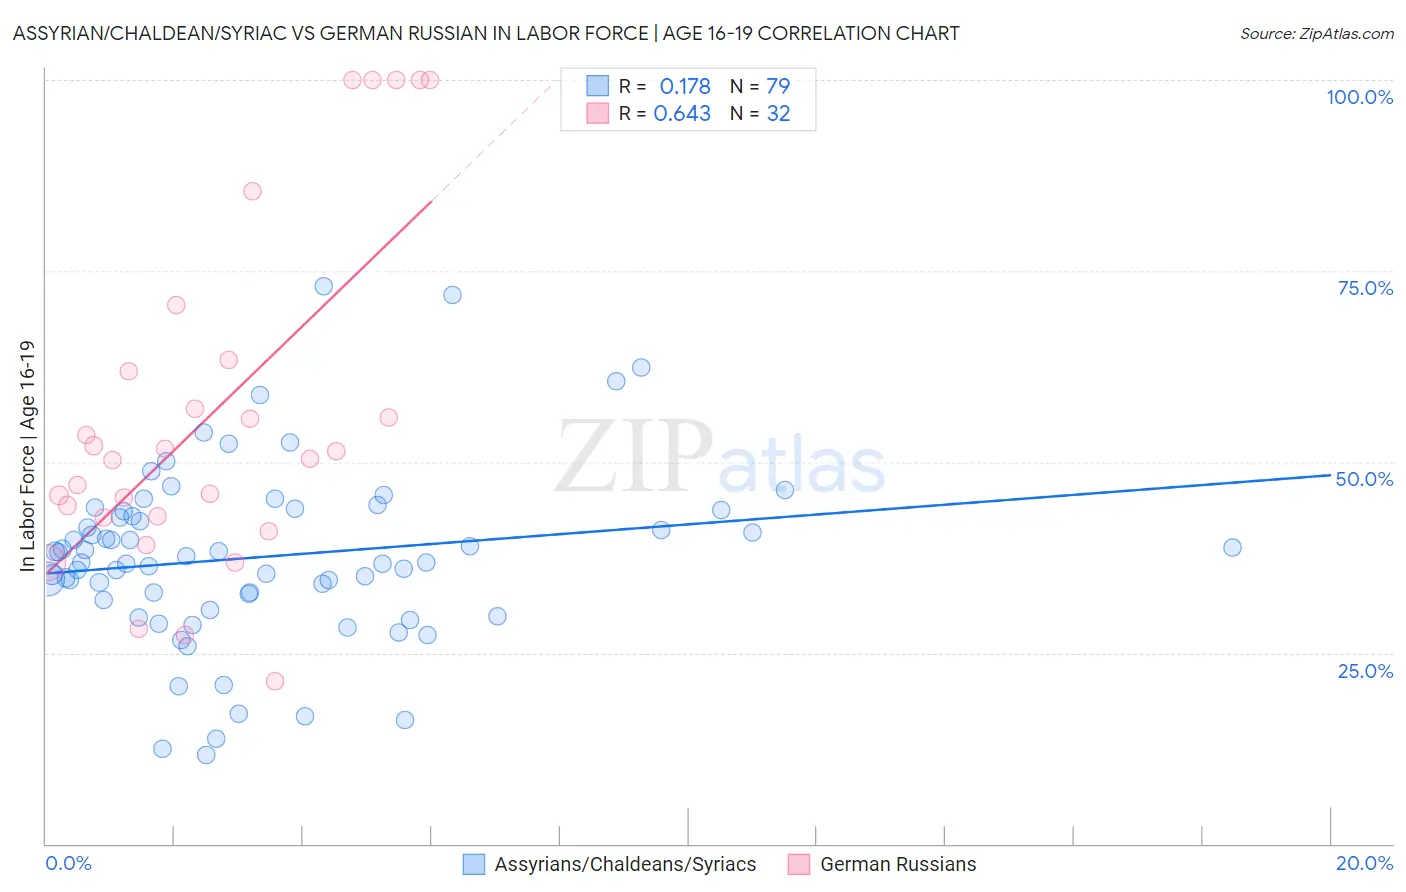
Assyrian/Chaldean/Syriac vs German Russian In Labor Force | Age 16-19 Correlation Chart

The statistical analysis conducted on geographies consisting of 110,301,649 people shows a poor positive correlation between the proportion of Assyrians/Chaldeans/Syriacs and labor force participation rate among population between the ages 16 and 19 in the United States with a correlation coefficient (R) of 0.178 and weighted average of 38.3%. Similarly, the statistical analysis conducted on geographies consisting of 96,426,343 people shows a significant positive correlation between the proportion of German Russians and labor force participation rate among population between the ages 16 and 19 in the United States with a correlation coefficient (R) of 0.643 and weighted average of 42.4%, a difference of 10.7%.
Assyrian/Chaldean/Syriac vs German Russian In Labor Force | Age 16-19

In Labor Force | Age 16-19 Correlation Summary

MeasurementAssyrian/Chaldean/SyriacGerman Russian
Minimum11.7%21.3%
Maximum73.0%100.0%
Range61.3%78.7%
Mean37.5%56.3%
Median36.8%50.9%
Interquartile 25% (IQ1)31.8%42.8%
Interquartile 75% (IQ3)43.5%62.6%
Interquartile Range (IQR)11.7%19.8%
Standard Deviation (Sample)11.6%22.7%
Standard Deviation (Population)11.6%22.3%

Similar Demographics by In Labor Force | Age 16-19

Demographics Similar to Assyrians/Chaldeans/Syriacs by In Labor Force | Age 16-19

In terms of in labor force | age 16-19, the demographic groups most similar to Assyrians/Chaldeans/Syriacs are Immigrants from Nepal (38.3%, a difference of 0.020%), Chickasaw (38.3%, a difference of 0.030%), Bulgarian (38.3%, a difference of 0.080%), Colville (38.3%, a difference of 0.080%), and Ukrainian (38.3%, a difference of 0.090%).
DemographicsRating | RankIn Labor Force | Age 16-19
Immigrants | Scotland
98.5
/100
|
#112
Exceptional
38.5%
Sub-Saharan Africans
98.3
/100
|
#113
Exceptional
38.4%
Hawaiians
98.2
/100
|
#114
Exceptional
38.4%
Bulgarians
97.9
/100
|
#115
Exceptional
38.3%
Colville
97.9
/100
|
#116
Exceptional
38.3%
Chickasaw
97.8
/100
|
#117
Exceptional
38.3%
Immigrants | Nepal
97.8
/100
|
#118
Exceptional
38.3%
Assyrians/Chaldeans/Syriacs
97.8
/100
|
#119
Exceptional
38.3%
Ukrainians
97.6
/100
|
#120
Exceptional
38.3%
Ethiopians
97.4
/100
|
#121
Exceptional
38.2%
Guamanians/Chamorros
97.4
/100
|
#122
Exceptional
38.2%
Seminole
96.7
/100
|
#123
Exceptional
38.1%
Immigrants | England
96.4
/100
|
#124
Exceptional
38.1%
Immigrants | Africa
96.1
/100
|
#125
Exceptional
38.0%
Africans
95.6
/100
|
#126
Exceptional
38.0%

Demographics Similar to German Russians by In Labor Force | Age 16-19

In terms of in labor force | age 16-19, the demographic groups most similar to German Russians are Bangladeshi (42.5%, a difference of 0.080%), English (42.4%, a difference of 0.13%), Welsh (42.3%, a difference of 0.40%), Slovak (42.6%, a difference of 0.41%), and Polish (42.1%, a difference of 0.70%).
DemographicsRating | RankIn Labor Force | Age 16-19
French Canadians
100.0
/100
|
#18
Exceptional
43.6%
Belgians
100.0
/100
|
#19
Exceptional
43.4%
Swiss
100.0
/100
|
#20
Exceptional
43.3%
Ottawa
100.0
/100
|
#21
Exceptional
43.0%
Sudanese
100.0
/100
|
#22
Exceptional
42.9%
Slovaks
100.0
/100
|
#23
Exceptional
42.6%
Bangladeshis
100.0
/100
|
#24
Exceptional
42.5%
German Russians
100.0
/100
|
#25
Exceptional
42.4%
English
100.0
/100
|
#26
Exceptional
42.4%
Welsh
100.0
/100
|
#27
Exceptional
42.3%
Poles
100.0
/100
|
#28
Exceptional
42.1%
French
100.0
/100
|
#29
Exceptional
42.1%
Scottish
100.0
/100
|
#30
Exceptional
42.0%
Irish
100.0
/100
|
#31
Exceptional
42.0%
Czechoslovakians
100.0
/100
|
#32
Exceptional
41.9%