Assyrian/Chaldean/Syriac vs Macedonian In Labor Force | Age 16-19

COMPARE

Assyrian/Chaldean/Syriac
Race
Ancestry
AfghanAfricanAlaska NativeAlaskan AthabascanAlbanianAleutAlsatianAmericanApacheArabArapahoArgentineanArmenianAssyrian/Chaldean/SyriacAustralianAustrianBahamianBangladeshiBarbadianBasqueBelgianBelizeanBermudanBhutaneseBlackfeetBolivianBrazilianBritishBritish West IndianBulgarianBurmeseCajunCambodianCanadianCape VerdeanCarpatho RusynCelticCentral AmericanCentral American IndianCherokeeCheyenneChickasawChileanChineseChippewaChoctawColombianColvilleComancheCosta RicanCreeCreekCroatianCrowCubanCypriotCzechCzechoslovakianDanishDelawareDominicanDutchDutch West IndianEastern EuropeanEcuadorianEgyptianEnglishEstonianEthiopianEuropeanFijianFilipinoFinnishFrenchFrench American IndianFrench CanadianGermanGerman RussianGhanaianGreekGuamanian/ChamorroGuatemalanGuyaneseHaitianHmongHonduranHopiHoumaHungarianIcelanderIndian (Asian)IndonesianInupiatIranianIraqiIrishIroquoisIsraeliItalianJamaicanJapaneseJordanianKenyanKiowaKoreanLaotianLatvianLebaneseLiberianLithuanianLumbeeLuxembourgerMalaysianMalteseMarshalleseMenomineeMexicanMexican American IndianMongolianMoroccanNative HawaiianNavajoNepaleseNew ZealanderNicaraguanNigerianNorthern EuropeanNorwegianOkinawanOsageOttawaPaiutePakistaniPalestinianPanamanianParaguayanPennsylvania GermanPeruvianPimaPolishPortuguesePotawatomiPuebloPuerto RicanPuget Sound SalishRomanianRussianSalvadoranSamoanScandinavianScotch-IrishScottishSeminoleSenegaleseSerbianShoshoneSierra LeoneanSiouxSlavicSlovakSloveneSomaliSouth AfricanSouth AmericanSouth American IndianSoviet UnionSpaniardSpanishSpanish AmericanSpanish American IndianSri LankanSubsaharan AfricanSudaneseSwedishSwissSyrianTaiwaneseThaiTlingit-HaidaTohono O'OdhamTonganTrinidadian and TobagonianTsimshianTurkishU.S. Virgin IslanderUgandanUkrainianUruguayanUteVenezuelanVietnameseWelshWest IndianYakamaYaquiYugoslavianYumanYup'ikZimbabwean
Immigration
NonimmigrantsImmigrantsAfghanistanAfricaAlbaniaArgentinaArmeniaAsiaAustraliaAustriaBahamasBangladeshBarbadosBelarusBelgiumBelizeBoliviaBosnia and HerzegovinaBrazilBulgariaBurma/MyanmarCabo VerdeCambodiaCameroonCanadaCaribbeanCentral AmericaChileChinaColombiaCongoCosta RicaCroatiaCubaCzechoslovakiaDenmarkDominicaDominican RepublicEastern AfricaEastern AsiaEastern EuropeEcuadorEgyptEl SalvadorEnglandEritreaEthiopiaEuropeFijiFranceGermanyGhanaGreeceGrenadaGuatemalaGuyanaHaitiHondurasHong KongHungaryIndiaIndonesiaIranIraqIrelandIsraelItalyJamaicaJapanJordanKazakhstanKenyaKoreaKuwaitLaosLatin AmericaLatviaLebanonLiberiaLithuaniaMalaysiaMexicoMicronesiaMiddle AfricaMoldovaMoroccoNepalNetherlandsNicaraguaNigeriaNorth AmericaNorth MacedoniaNorthern AfricaNorthern EuropeNorwayOceaniaPakistanPanamaPeruPhilippinesPolandPortugalRomaniaRussiaSaudi ArabiaScotlandSenegalSerbiaSierra LeoneSingaporeSomaliaSouth AfricaSouth AmericaSouth Central AsiaSouth Eastern AsiaSouthern EuropeSpainSri LankaSt. Vincent and the GrenadinesSudanSwedenSwitzerlandSyriaTaiwanThailandTrinidad and TobagoTurkeyUgandaUkraineUruguayUzbekistanVenezuelaVietnamWest IndiesWestern AfricaWestern AsiaWestern EuropeYemenZaireZimbabweAzores
Macedonian
Race
Ancestry
AfghanAfricanAlaska NativeAlaskan AthabascanAlbanianAleutAlsatianAmericanApacheArabArapahoArgentineanArmenianAustralianAustrianBahamianBangladeshiBarbadianBasqueBelgianBelizeanBermudanBhutaneseBlackfeetBolivianBrazilianBritishBritish West IndianBulgarianBurmeseCajunCambodianCanadianCape VerdeanCarpatho RusynCelticCentral AmericanCentral American IndianCherokeeCheyenneChickasawChileanChineseChippewaChoctawColombianColvilleComancheCosta RicanCreeCreekCroatianCrowCubanCypriotCzechCzechoslovakianDanishDelawareDominicanDutchDutch West IndianEastern EuropeanEcuadorianEgyptianEnglishEstonianEthiopianEuropeanFijianFilipinoFinnishFrenchFrench American IndianFrench CanadianGermanGerman RussianGhanaianGreekGuamanian/ChamorroGuatemalanGuyaneseHaitianHmongHonduranHopiHoumaHungarianIcelanderIndian (Asian)IndonesianInupiatIranianIraqiIrishIroquoisIsraeliItalianJamaicanJapaneseJordanianKenyanKiowaKoreanLaotianLatvianLebaneseLiberianLithuanianLumbeeLuxembourgerMacedonianMalaysianMalteseMarshalleseMenomineeMexicanMexican American IndianMongolianMoroccanNative HawaiianNavajoNepaleseNew ZealanderNicaraguanNigerianNorthern EuropeanNorwegianOkinawanOsageOttawaPaiutePakistaniPalestinianPanamanianParaguayanPennsylvania GermanPeruvianPimaPolishPortuguesePotawatomiPuebloPuerto RicanPuget Sound SalishRomanianRussianSalvadoranSamoanScandinavianScotch-IrishScottishSeminoleSenegaleseSerbianShoshoneSierra LeoneanSiouxSlavicSlovakSloveneSomaliSouth AfricanSouth AmericanSouth American IndianSoviet UnionSpaniardSpanishSpanish AmericanSpanish American IndianSri LankanSubsaharan AfricanSudaneseSwedishSwissSyrianTaiwaneseThaiTlingit-HaidaTohono O'OdhamTonganTrinidadian and TobagonianTsimshianTurkishU.S. Virgin IslanderUgandanUkrainianUruguayanUteVenezuelanVietnameseWelshWest IndianYakamaYaquiYugoslavianYumanYup'ikZimbabwean
Immigration
NonimmigrantsImmigrantsAfghanistanAfricaAlbaniaArgentinaArmeniaAsiaAustraliaAustriaBahamasBangladeshBarbadosBelarusBelgiumBelizeBoliviaBosnia and HerzegovinaBrazilBulgariaBurma/MyanmarCabo VerdeCambodiaCameroonCanadaCaribbeanCentral AmericaChileChinaColombiaCongoCosta RicaCroatiaCubaCzechoslovakiaDenmarkDominicaDominican RepublicEastern AfricaEastern AsiaEastern EuropeEcuadorEgyptEl SalvadorEnglandEritreaEthiopiaEuropeFijiFranceGermanyGhanaGreeceGrenadaGuatemalaGuyanaHaitiHondurasHong KongHungaryIndiaIndonesiaIranIraqIrelandIsraelItalyJamaicaJapanJordanKazakhstanKenyaKoreaKuwaitLaosLatin AmericaLatviaLebanonLiberiaLithuaniaMalaysiaMexicoMicronesiaMiddle AfricaMoldovaMoroccoNepalNetherlandsNicaraguaNigeriaNorth AmericaNorth MacedoniaNorthern AfricaNorthern EuropeNorwayOceaniaPakistanPanamaPeruPhilippinesPolandPortugalRomaniaRussiaSaudi ArabiaScotlandSenegalSerbiaSierra LeoneSingaporeSomaliaSouth AfricaSouth AmericaSouth Central AsiaSouth Eastern AsiaSouthern EuropeSpainSri LankaSt. Vincent and the GrenadinesSudanSwedenSwitzerlandSyriaTaiwanThailandTrinidad and TobagoTurkeyUgandaUkraineUruguayUzbekistanVenezuelaVietnamWest IndiesWestern AfricaWestern AsiaWestern EuropeYemenZaireZimbabweAzores
In Labor Force | Age 16-19
Income
Poverty
Unemployment
Labor Participation
Family Structure
Vehicle Availability
Education Level
Disability

In Labor Force | Age 16-19 Comparison

Assyrians/Chaldeans/Syriacs

Macedonians

Exceptional
Exceptional
38.3%
IN LABOR FORCE | AGE 16-19
97.8/ 100
METRIC RATING
119th/ 347
METRIC RANK
37.8%
IN LABOR FORCE | AGE 16-19
93.4/ 100
METRIC RATING
135th/ 347
METRIC RANK

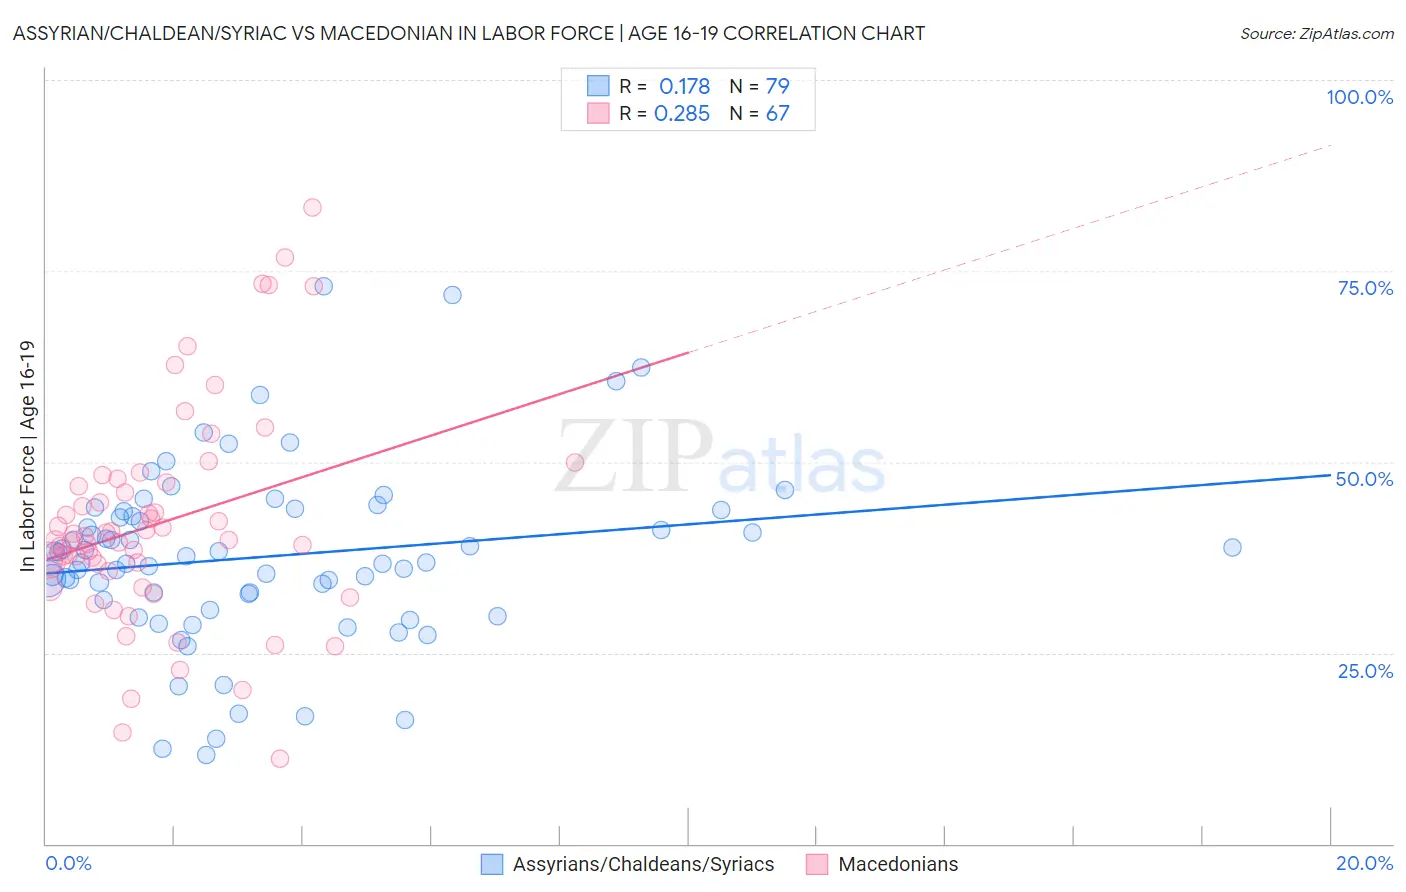
Assyrian/Chaldean/Syriac vs Macedonian In Labor Force | Age 16-19 Correlation Chart

The statistical analysis conducted on geographies consisting of 110,301,649 people shows a poor positive correlation between the proportion of Assyrians/Chaldeans/Syriacs and labor force participation rate among population between the ages 16 and 19 in the United States with a correlation coefficient (R) of 0.178 and weighted average of 38.3%. Similarly, the statistical analysis conducted on geographies consisting of 132,590,636 people shows a weak positive correlation between the proportion of Macedonians and labor force participation rate among population between the ages 16 and 19 in the United States with a correlation coefficient (R) of 0.285 and weighted average of 37.8%, a difference of 1.4%.
Assyrian/Chaldean/Syriac vs Macedonian In Labor Force | Age 16-19

In Labor Force | Age 16-19 Correlation Summary

MeasurementAssyrian/Chaldean/SyriacMacedonian
Minimum11.7%11.2%
Maximum73.0%83.3%
Range61.3%72.1%
Mean37.5%41.9%
Median36.8%39.8%
Interquartile 25% (IQ1)31.8%35.7%
Interquartile 75% (IQ3)43.5%47.3%
Interquartile Range (IQR)11.7%11.5%
Standard Deviation (Sample)11.6%14.1%
Standard Deviation (Population)11.6%13.9%

Demographics Similar to Assyrians/Chaldeans/Syriacs and Macedonians by In Labor Force | Age 16-19

In terms of in labor force | age 16-19, the demographic groups most similar to Assyrians/Chaldeans/Syriacs are Immigrants from Nepal (38.3%, a difference of 0.020%), Chickasaw (38.3%, a difference of 0.030%), Ukrainian (38.3%, a difference of 0.090%), Ethiopian (38.2%, a difference of 0.19%), and Guamanian/Chamorro (38.2%, a difference of 0.22%). Similarly, the demographic groups most similar to Macedonians are Australian (37.8%, a difference of 0.030%), Cajun (37.8%, a difference of 0.030%), Immigrants from Netherlands (37.8%, a difference of 0.060%), Cheyenne (37.9%, a difference of 0.27%), and Immigrants from Oceania (37.9%, a difference of 0.29%).
DemographicsRating | RankIn Labor Force | Age 16-19
Chickasaw
97.8
/100
|
#117
Exceptional
38.3%
Immigrants | Nepal
97.8
/100
|
#118
Exceptional
38.3%
Assyrians/Chaldeans/Syriacs
97.8
/100
|
#119
Exceptional
38.3%
Ukrainians
97.6
/100
|
#120
Exceptional
38.3%
Ethiopians
97.4
/100
|
#121
Exceptional
38.2%
Guamanians/Chamorros
97.4
/100
|
#122
Exceptional
38.2%
Seminole
96.7
/100
|
#123
Exceptional
38.1%
Immigrants | England
96.4
/100
|
#124
Exceptional
38.1%
Immigrants | Africa
96.1
/100
|
#125
Exceptional
38.0%
Africans
95.6
/100
|
#126
Exceptional
38.0%
Choctaw
95.6
/100
|
#127
Exceptional
38.0%
New Zealanders
95.6
/100
|
#128
Exceptional
38.0%
Spaniards
95.5
/100
|
#129
Exceptional
38.0%
Immigrants | Zimbabwe
95.4
/100
|
#130
Exceptional
38.0%
Immigrants | Austria
95.0
/100
|
#131
Exceptional
37.9%
Immigrants | Oceania
94.7
/100
|
#132
Exceptional
37.9%
Cheyenne
94.6
/100
|
#133
Exceptional
37.9%
Immigrants | Netherlands
93.7
/100
|
#134
Exceptional
37.8%
Macedonians
93.4
/100
|
#135
Exceptional
37.8%
Australians
93.2
/100
|
#136
Exceptional
37.8%
Cajuns
93.2
/100
|
#137
Exceptional
37.8%