Assyrian/Chaldean/Syriac vs Bhutanese Unemployment Among Ages 20 to 24 years
COMPARE
Assyrian/Chaldean/Syriac
Bhutanese
Unemployment Among Ages 20 to 24 years
Unemployment Among Ages 20 to 24 years Comparison
Assyrians/Chaldeans/Syriacs
Bhutanese
9.9%
UNEMPLOYMENT AMONG AGES 20 TO 24 YEARS
98.3/ 100
METRIC RATING
78th/ 347
METRIC RANK
10.0%
UNEMPLOYMENT AMONG AGES 20 TO 24 YEARS
96.9/ 100
METRIC RATING
91st/ 347
METRIC RANK
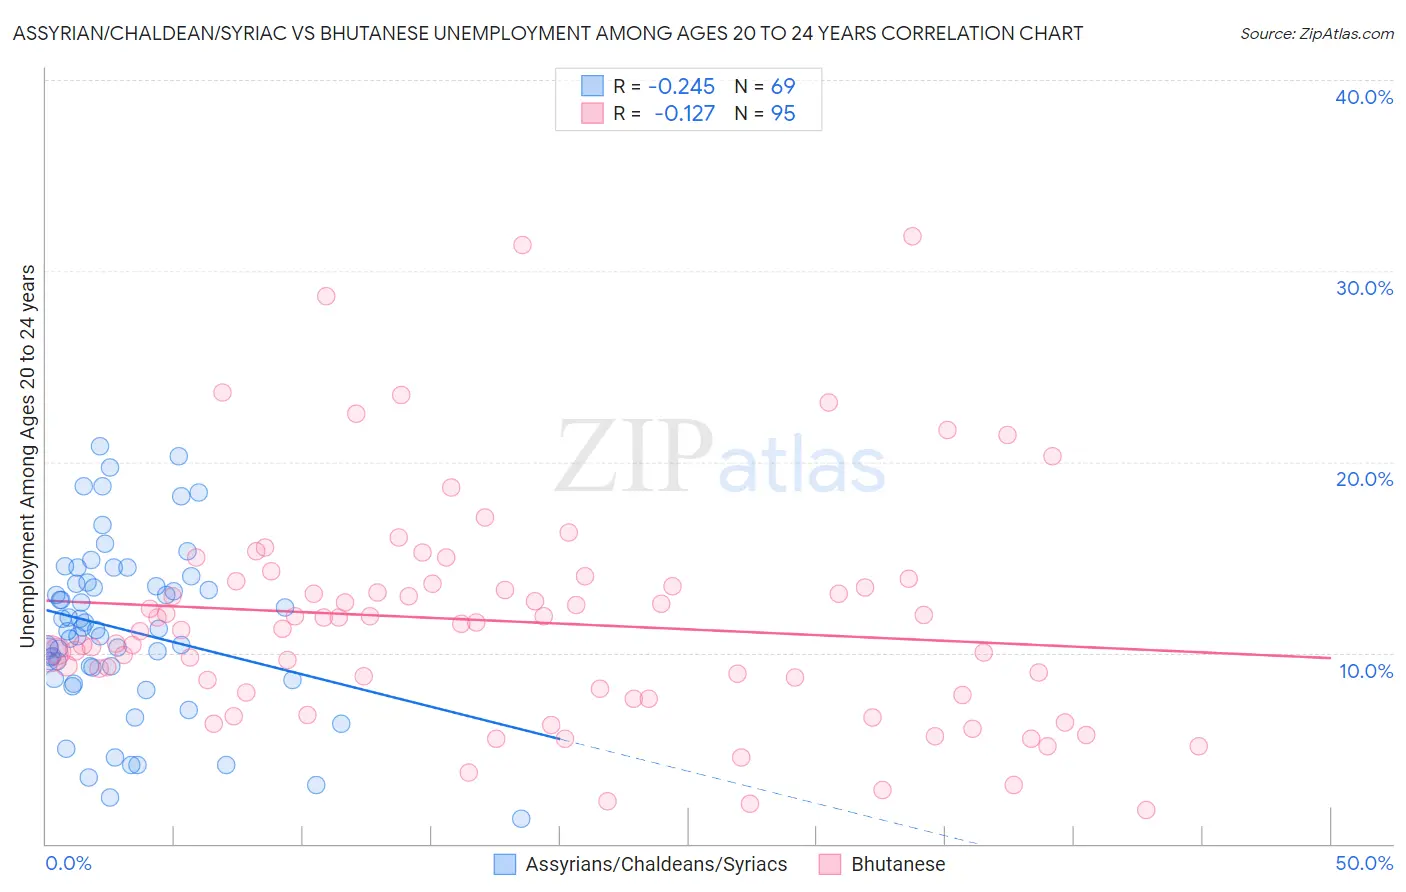
Assyrian/Chaldean/Syriac vs Bhutanese Unemployment Among Ages 20 to 24 years Correlation Chart
The statistical analysis conducted on geographies consisting of 109,491,073 people shows a weak negative correlation between the proportion of Assyrians/Chaldeans/Syriacs and unemployment rate among population between the ages 20 and 24 in the United States with a correlation coefficient (R) of -0.245 and weighted average of 9.9%. Similarly, the statistical analysis conducted on geographies consisting of 437,376,802 people shows a poor negative correlation between the proportion of Bhutanese and unemployment rate among population between the ages 20 and 24 in the United States with a correlation coefficient (R) of -0.127 and weighted average of 10.0%, a difference of 0.59%.
Unemployment Among Ages 20 to 24 years Correlation Summary
| Measurement | Assyrian/Chaldean/Syriac | Bhutanese |
| Minimum | 1.3% | 1.8% |
| Maximum | 20.8% | 31.8% |
| Range | 19.5% | 30.0% |
| Mean | 11.2% | 11.6% |
| Median | 11.2% | 11.3% |
| Interquartile 25% (IQ1) | 8.9% | 7.8% |
| Interquartile 75% (IQ3) | 13.7% | 13.6% |
| Interquartile Range (IQR) | 4.8% | 5.8% |
| Standard Deviation (Sample) | 4.4% | 5.9% |
| Standard Deviation (Population) | 4.3% | 5.9% |
Demographics Similar to Assyrians/Chaldeans/Syriacs and Bhutanese by Unemployment Among Ages 20 to 24 years
In terms of unemployment among ages 20 to 24 years, the demographic groups most similar to Assyrians/Chaldeans/Syriacs are Icelander (9.9%, a difference of 0.020%), Chickasaw (9.9%, a difference of 0.030%), Czechoslovakian (9.9%, a difference of 0.050%), Immigrants from Netherlands (9.9%, a difference of 0.070%), and Immigrants from Australia (9.9%, a difference of 0.14%). Similarly, the demographic groups most similar to Bhutanese are Bangladeshi (10.0%, a difference of 0.010%), Immigrants from Malaysia (10.0%, a difference of 0.020%), Macedonian (10.0%, a difference of 0.030%), Chilean (10.0%, a difference of 0.030%), and Polish (10.0%, a difference of 0.050%).
| Demographics | Rating | Rank | Unemployment Among Ages 20 to 24 years |
| Immigrants | Laos | 98.7 /100 | #74 | Exceptional 9.9% |
| Immigrants | Australia | 98.6 /100 | #75 | Exceptional 9.9% |
| Czechoslovakians | 98.4 /100 | #76 | Exceptional 9.9% |
| Chickasaw | 98.4 /100 | #77 | Exceptional 9.9% |
| Assyrians/Chaldeans/Syriacs | 98.3 /100 | #78 | Exceptional 9.9% |
| Icelanders | 98.3 /100 | #79 | Exceptional 9.9% |
| Immigrants | Netherlands | 98.2 /100 | #80 | Exceptional 9.9% |
| Yaqui | 98.0 /100 | #81 | Exceptional 9.9% |
| Sri Lankans | 98.0 /100 | #82 | Exceptional 9.9% |
| Immigrants | Bulgaria | 98.0 /100 | #83 | Exceptional 9.9% |
| Latvians | 97.9 /100 | #84 | Exceptional 9.9% |
| New Zealanders | 97.8 /100 | #85 | Exceptional 9.9% |
| Immigrants | Vietnam | 97.5 /100 | #86 | Exceptional 10.0% |
| Immigrants | Oceania | 97.4 /100 | #87 | Exceptional 10.0% |
| Poles | 97.1 /100 | #88 | Exceptional 10.0% |
| Macedonians | 97.0 /100 | #89 | Exceptional 10.0% |
| Chileans | 97.0 /100 | #90 | Exceptional 10.0% |
| Bhutanese | 96.9 /100 | #91 | Exceptional 10.0% |
| Bangladeshis | 96.9 /100 | #92 | Exceptional 10.0% |
| Immigrants | Malaysia | 96.9 /100 | #93 | Exceptional 10.0% |
| Immigrants | Micronesia | 96.6 /100 | #94 | Exceptional 10.0% |