Iraqi vs Bhutanese In Labor Force | Age 16-19
COMPARE
Iraqi
Bhutanese
In Labor Force | Age 16-19
In Labor Force | Age 16-19 Comparison
Iraqis
Bhutanese
38.6%
IN LABOR FORCE | AGE 16-19
98.9/ 100
METRIC RATING
105th/ 347
METRIC RANK
36.3%
IN LABOR FORCE | AGE 16-19
35.3/ 100
METRIC RATING
185th/ 347
METRIC RANK
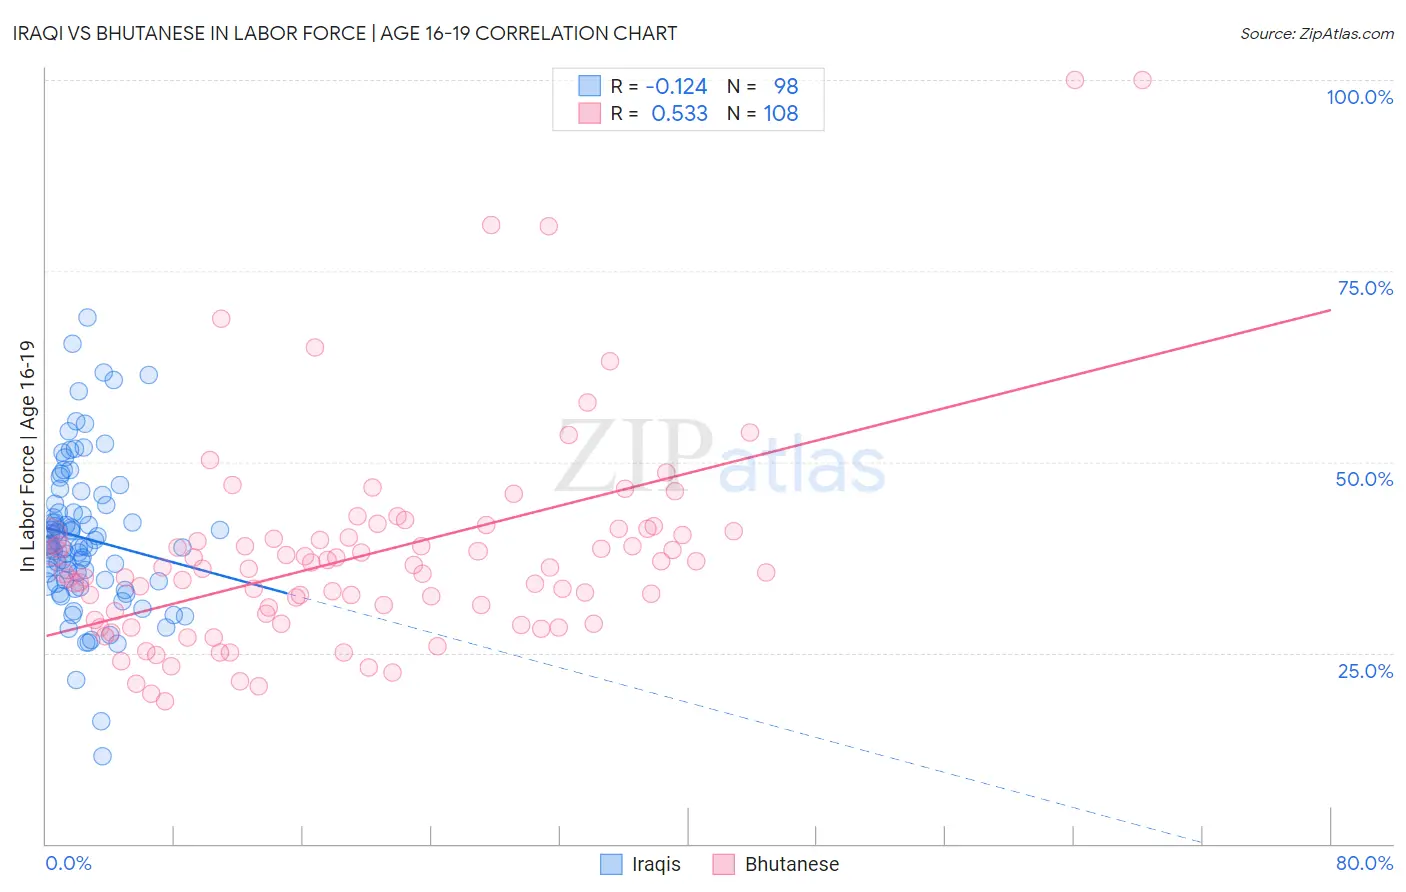
Iraqi vs Bhutanese In Labor Force | Age 16-19 Correlation Chart
The statistical analysis conducted on geographies consisting of 170,586,304 people shows a poor negative correlation between the proportion of Iraqis and labor force participation rate among population between the ages 16 and 19 in the United States with a correlation coefficient (R) of -0.124 and weighted average of 38.6%. Similarly, the statistical analysis conducted on geographies consisting of 454,665,515 people shows a substantial positive correlation between the proportion of Bhutanese and labor force participation rate among population between the ages 16 and 19 in the United States with a correlation coefficient (R) of 0.533 and weighted average of 36.3%, a difference of 6.4%.
In Labor Force | Age 16-19 Correlation Summary
| Measurement | Iraqi | Bhutanese |
| Minimum | 11.4% | 18.6% |
| Maximum | 68.9% | 100.0% |
| Range | 57.5% | 81.4% |
| Mean | 40.0% | 37.8% |
| Median | 39.0% | 36.0% |
| Interquartile 25% (IQ1) | 34.4% | 29.8% |
| Interquartile 75% (IQ3) | 44.3% | 40.4% |
| Interquartile Range (IQR) | 9.9% | 10.6% |
| Standard Deviation (Sample) | 9.8% | 13.9% |
| Standard Deviation (Population) | 9.8% | 13.8% |
Similar Demographics by In Labor Force | Age 16-19
Demographics Similar to Iraqis by In Labor Force | Age 16-19
In terms of in labor force | age 16-19, the demographic groups most similar to Iraqis are Delaware (38.6%, a difference of 0.020%), Chinese (38.6%, a difference of 0.050%), Immigrants from Ethiopia (38.6%, a difference of 0.15%), Lebanese (38.6%, a difference of 0.15%), and Immigrants from Eritrea (38.7%, a difference of 0.16%).
| Demographics | Rating | Rank | In Labor Force | Age 16-19 |
| Ugandans | 99.3 /100 | #98 | Exceptional 38.9% |
| Immigrants | North Macedonia | 99.3 /100 | #99 | Exceptional 38.9% |
| Immigrants | Thailand | 99.1 /100 | #100 | Exceptional 38.7% |
| Hmong | 99.1 /100 | #101 | Exceptional 38.7% |
| Zimbabweans | 99.1 /100 | #102 | Exceptional 38.7% |
| Immigrants | Cameroon | 99.0 /100 | #103 | Exceptional 38.7% |
| Immigrants | Eritrea | 99.0 /100 | #104 | Exceptional 38.7% |
| Iraqis | 98.9 /100 | #105 | Exceptional 38.6% |
| Delaware | 98.8 /100 | #106 | Exceptional 38.6% |
| Chinese | 98.8 /100 | #107 | Exceptional 38.6% |
| Immigrants | Ethiopia | 98.7 /100 | #108 | Exceptional 38.6% |
| Lebanese | 98.7 /100 | #109 | Exceptional 38.6% |
| Maltese | 98.6 /100 | #110 | Exceptional 38.5% |
| Crow | 98.5 /100 | #111 | Exceptional 38.5% |
| Immigrants | Scotland | 98.5 /100 | #112 | Exceptional 38.5% |
Demographics Similar to Bhutanese by In Labor Force | Age 16-19
In terms of in labor force | age 16-19, the demographic groups most similar to Bhutanese are Costa Rican (36.3%, a difference of 0.040%), Immigrants from Romania (36.3%, a difference of 0.070%), Immigrants from Afghanistan (36.3%, a difference of 0.080%), Eastern European (36.4%, a difference of 0.19%), and Immigrants from Europe (36.2%, a difference of 0.20%).
| Demographics | Rating | Rank | In Labor Force | Age 16-19 |
| Blacks/African Americans | 45.1 /100 | #178 | Average 36.5% |
| Immigrants | Southern Europe | 43.3 /100 | #179 | Average 36.4% |
| Immigrants | Morocco | 41.1 /100 | #180 | Average 36.4% |
| Jordanians | 39.6 /100 | #181 | Fair 36.4% |
| Immigrants | Italy | 39.1 /100 | #182 | Fair 36.4% |
| Eastern Europeans | 38.8 /100 | #183 | Fair 36.4% |
| Costa Ricans | 36.1 /100 | #184 | Fair 36.3% |
| Bhutanese | 35.3 /100 | #185 | Fair 36.3% |
| Immigrants | Romania | 34.0 /100 | #186 | Fair 36.3% |
| Immigrants | Afghanistan | 34.0 /100 | #187 | Fair 36.3% |
| Immigrants | Europe | 31.8 /100 | #188 | Fair 36.2% |
| Immigrants | Hungary | 28.8 /100 | #189 | Fair 36.2% |
| Panamanians | 28.6 /100 | #190 | Fair 36.1% |
| Immigrants | Croatia | 27.5 /100 | #191 | Fair 36.1% |
| Afghans | 25.7 /100 | #192 | Fair 36.1% |