Hungarian vs Bhutanese In Labor Force | Age 16-19
COMPARE
Hungarian
Bhutanese
In Labor Force | Age 16-19
In Labor Force | Age 16-19 Comparison
Hungarians
Bhutanese
39.8%
IN LABOR FORCE | AGE 16-19
99.9/ 100
METRIC RATING
74th/ 347
METRIC RANK
36.3%
IN LABOR FORCE | AGE 16-19
35.3/ 100
METRIC RATING
185th/ 347
METRIC RANK
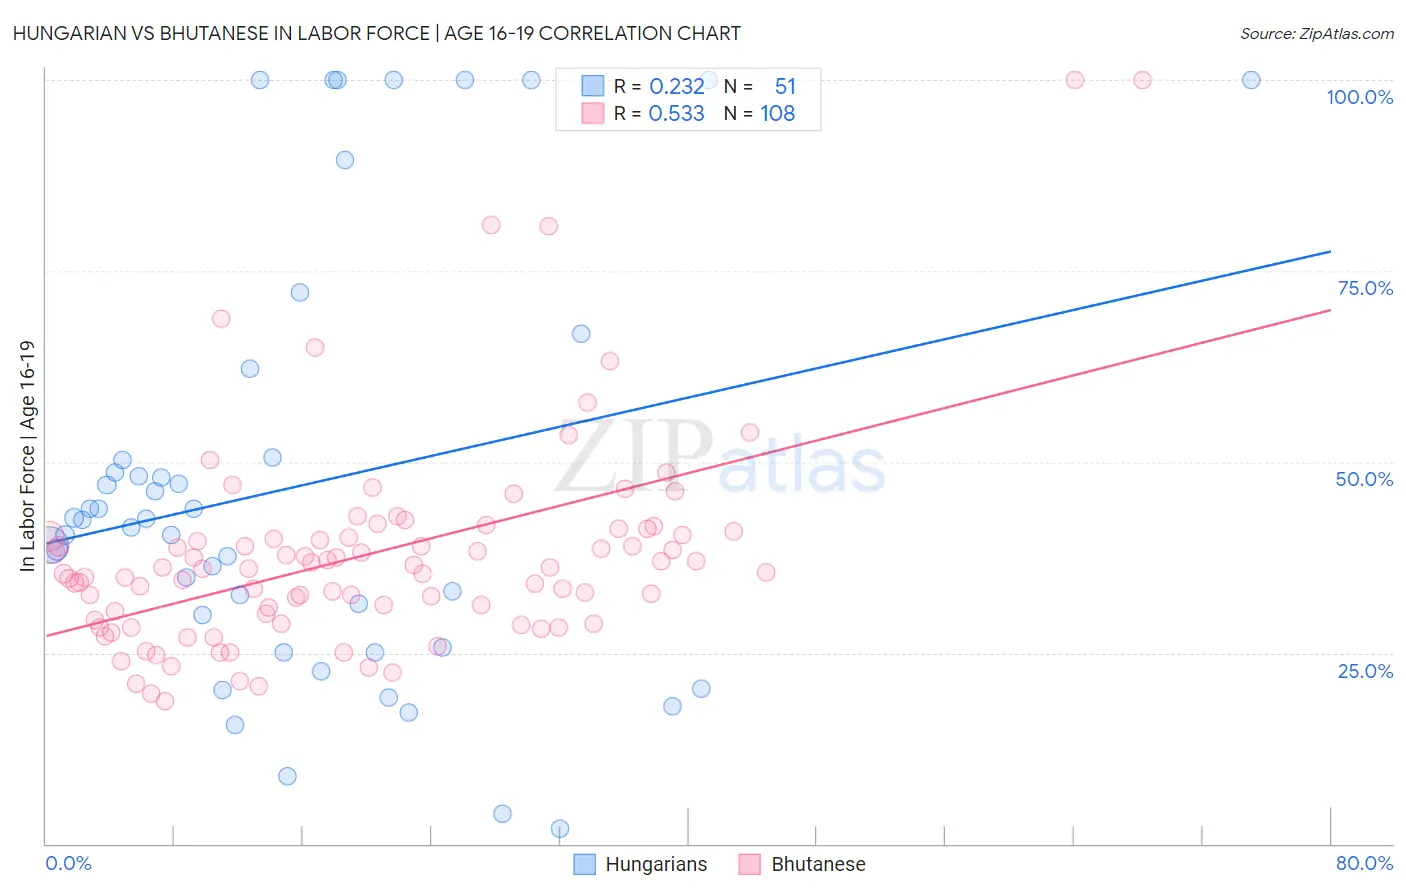
Hungarian vs Bhutanese In Labor Force | Age 16-19 Correlation Chart
The statistical analysis conducted on geographies consisting of 484,680,746 people shows a weak positive correlation between the proportion of Hungarians and labor force participation rate among population between the ages 16 and 19 in the United States with a correlation coefficient (R) of 0.232 and weighted average of 39.8%. Similarly, the statistical analysis conducted on geographies consisting of 454,665,515 people shows a substantial positive correlation between the proportion of Bhutanese and labor force participation rate among population between the ages 16 and 19 in the United States with a correlation coefficient (R) of 0.533 and weighted average of 36.3%, a difference of 9.8%.
In Labor Force | Age 16-19 Correlation Summary
| Measurement | Hungarian | Bhutanese |
| Minimum | 2.0% | 18.6% |
| Maximum | 100.0% | 100.0% |
| Range | 98.0% | 81.4% |
| Mean | 47.0% | 37.8% |
| Median | 42.4% | 36.0% |
| Interquartile 25% (IQ1) | 25.7% | 29.8% |
| Interquartile 75% (IQ3) | 50.5% | 40.4% |
| Interquartile Range (IQR) | 24.8% | 10.6% |
| Standard Deviation (Sample) | 28.1% | 13.9% |
| Standard Deviation (Population) | 27.8% | 13.8% |
Similar Demographics by In Labor Force | Age 16-19
Demographics Similar to Hungarians by In Labor Force | Age 16-19
In terms of in labor force | age 16-19, the demographic groups most similar to Hungarians are French American Indian (39.8%, a difference of 0.020%), Immigrants from Middle Africa (39.9%, a difference of 0.23%), Iroquois (39.9%, a difference of 0.26%), Serbian (39.9%, a difference of 0.27%), and Malaysian (39.7%, a difference of 0.29%).
| Demographics | Rating | Rank | In Labor Force | Age 16-19 |
| Canadians | 100.0 /100 | #67 | Exceptional 40.1% |
| Italians | 99.9 /100 | #68 | Exceptional 40.1% |
| Potawatomi | 99.9 /100 | #69 | Exceptional 40.0% |
| Portuguese | 99.9 /100 | #70 | Exceptional 40.0% |
| Serbians | 99.9 /100 | #71 | Exceptional 39.9% |
| Iroquois | 99.9 /100 | #72 | Exceptional 39.9% |
| Immigrants | Middle Africa | 99.9 /100 | #73 | Exceptional 39.9% |
| Hungarians | 99.9 /100 | #74 | Exceptional 39.8% |
| French American Indians | 99.9 /100 | #75 | Exceptional 39.8% |
| Malaysians | 99.9 /100 | #76 | Exceptional 39.7% |
| Immigrants | Portugal | 99.9 /100 | #77 | Exceptional 39.7% |
| Austrians | 99.8 /100 | #78 | Exceptional 39.5% |
| Marshallese | 99.8 /100 | #79 | Exceptional 39.5% |
| Immigrants | Iraq | 99.8 /100 | #80 | Exceptional 39.4% |
| Shoshone | 99.7 /100 | #81 | Exceptional 39.3% |
Demographics Similar to Bhutanese by In Labor Force | Age 16-19
In terms of in labor force | age 16-19, the demographic groups most similar to Bhutanese are Costa Rican (36.3%, a difference of 0.040%), Immigrants from Romania (36.3%, a difference of 0.070%), Immigrants from Afghanistan (36.3%, a difference of 0.080%), Eastern European (36.4%, a difference of 0.19%), and Immigrants from Europe (36.2%, a difference of 0.20%).
| Demographics | Rating | Rank | In Labor Force | Age 16-19 |
| Blacks/African Americans | 45.1 /100 | #178 | Average 36.5% |
| Immigrants | Southern Europe | 43.3 /100 | #179 | Average 36.4% |
| Immigrants | Morocco | 41.1 /100 | #180 | Average 36.4% |
| Jordanians | 39.6 /100 | #181 | Fair 36.4% |
| Immigrants | Italy | 39.1 /100 | #182 | Fair 36.4% |
| Eastern Europeans | 38.8 /100 | #183 | Fair 36.4% |
| Costa Ricans | 36.1 /100 | #184 | Fair 36.3% |
| Bhutanese | 35.3 /100 | #185 | Fair 36.3% |
| Immigrants | Romania | 34.0 /100 | #186 | Fair 36.3% |
| Immigrants | Afghanistan | 34.0 /100 | #187 | Fair 36.3% |
| Immigrants | Europe | 31.8 /100 | #188 | Fair 36.2% |
| Immigrants | Hungary | 28.8 /100 | #189 | Fair 36.2% |
| Panamanians | 28.6 /100 | #190 | Fair 36.1% |
| Immigrants | Croatia | 27.5 /100 | #191 | Fair 36.1% |
| Afghans | 25.7 /100 | #192 | Fair 36.1% |