Asian vs Immigrants from Lithuania In Labor Force | Age 20-64
COMPARE
Asian
Immigrants from Lithuania
In Labor Force | Age 20-64
In Labor Force | Age 20-64 Comparison
Asians
Immigrants from Lithuania
80.2%
IN LABOR FORCE | AGE 20-64
97.7/ 100
METRIC RATING
79th/ 347
METRIC RANK
80.7%
IN LABOR FORCE | AGE 20-64
99.9/ 100
METRIC RATING
31st/ 347
METRIC RANK
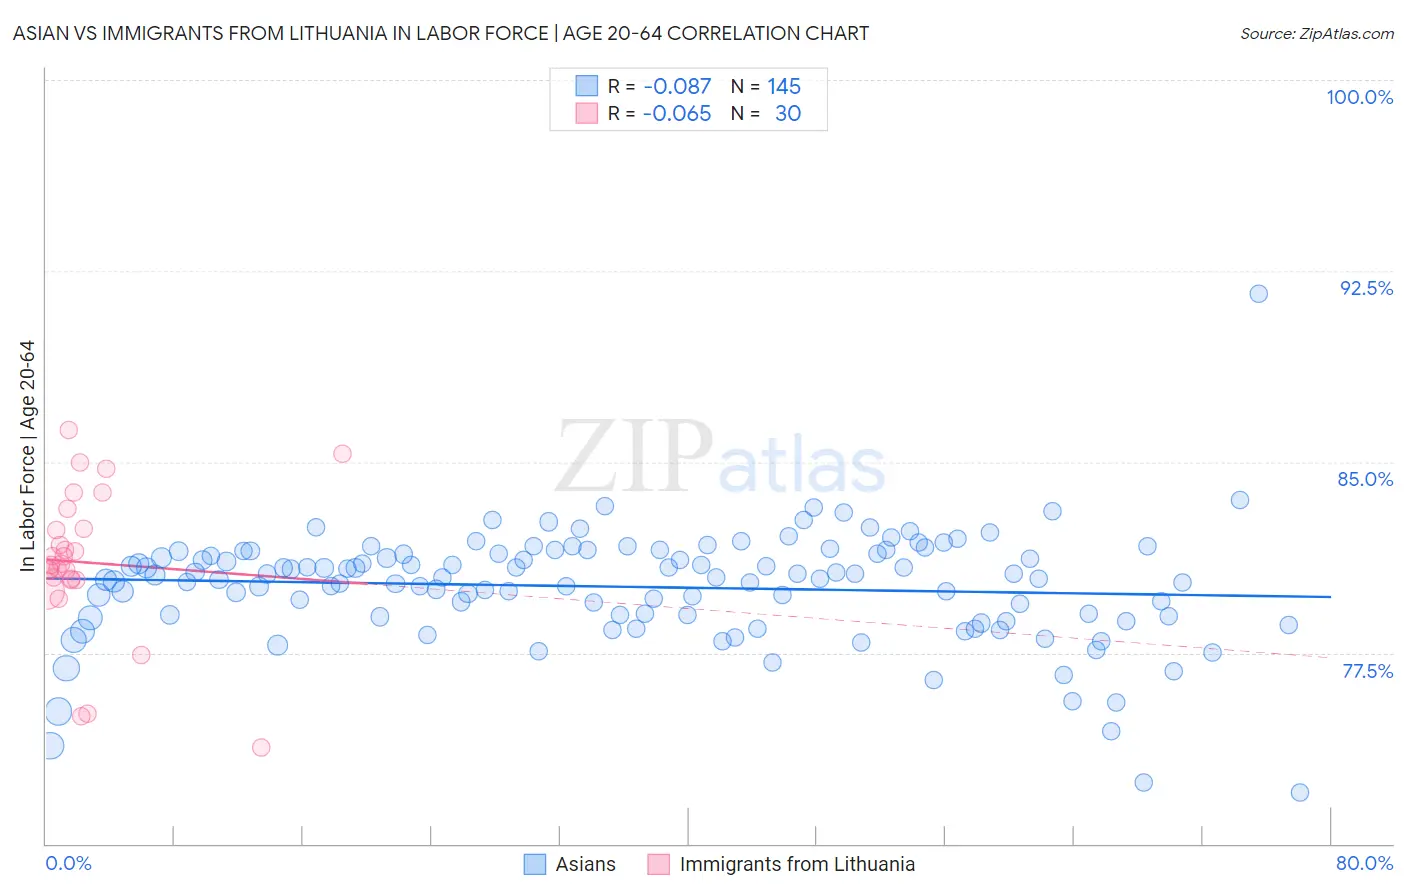
Asian vs Immigrants from Lithuania In Labor Force | Age 20-64 Correlation Chart
The statistical analysis conducted on geographies consisting of 550,934,136 people shows a slight negative correlation between the proportion of Asians and labor force participation rate among population between the ages 20 and 64 in the United States with a correlation coefficient (R) of -0.087 and weighted average of 80.2%. Similarly, the statistical analysis conducted on geographies consisting of 117,724,932 people shows a slight negative correlation between the proportion of Immigrants from Lithuania and labor force participation rate among population between the ages 20 and 64 in the United States with a correlation coefficient (R) of -0.065 and weighted average of 80.7%, a difference of 0.69%.
In Labor Force | Age 20-64 Correlation Summary
| Measurement | Asian | Immigrants from Lithuania |
| Minimum | 72.0% | 73.8% |
| Maximum | 91.6% | 86.3% |
| Range | 19.6% | 12.5% |
| Mean | 80.1% | 81.1% |
| Median | 80.5% | 81.0% |
| Interquartile 25% (IQ1) | 78.9% | 80.4% |
| Interquartile 75% (IQ3) | 81.4% | 82.3% |
| Interquartile Range (IQR) | 2.5% | 2.0% |
| Standard Deviation (Sample) | 2.2% | 2.9% |
| Standard Deviation (Population) | 2.2% | 2.8% |
Similar Demographics by In Labor Force | Age 20-64
Demographics Similar to Asians by In Labor Force | Age 20-64
In terms of in labor force | age 20-64, the demographic groups most similar to Asians are Egyptian (80.2%, a difference of 0.010%), Immigrants from Colombia (80.2%, a difference of 0.010%), Immigrants from Romania (80.2%, a difference of 0.010%), Immigrants from Croatia (80.1%, a difference of 0.010%), and Immigrants from Afghanistan (80.2%, a difference of 0.030%).
| Demographics | Rating | Rank | In Labor Force | Age 20-64 |
| Eastern Europeans | 98.4 /100 | #72 | Exceptional 80.2% |
| Cypriots | 98.2 /100 | #73 | Exceptional 80.2% |
| Immigrants | Eastern Europe | 98.1 /100 | #74 | Exceptional 80.2% |
| Immigrants | Afghanistan | 97.9 /100 | #75 | Exceptional 80.2% |
| Egyptians | 97.8 /100 | #76 | Exceptional 80.2% |
| Immigrants | Colombia | 97.8 /100 | #77 | Exceptional 80.2% |
| Immigrants | Romania | 97.8 /100 | #78 | Exceptional 80.2% |
| Asians | 97.7 /100 | #79 | Exceptional 80.2% |
| Immigrants | Croatia | 97.6 /100 | #80 | Exceptional 80.1% |
| German Russians | 97.3 /100 | #81 | Exceptional 80.1% |
| Immigrants | Japan | 97.3 /100 | #82 | Exceptional 80.1% |
| Colombians | 97.3 /100 | #83 | Exceptional 80.1% |
| Immigrants | Latvia | 97.2 /100 | #84 | Exceptional 80.1% |
| Jordanians | 97.2 /100 | #85 | Exceptional 80.1% |
| Immigrants | Egypt | 97.1 /100 | #86 | Exceptional 80.1% |
Demographics Similar to Immigrants from Lithuania by In Labor Force | Age 20-64
In terms of in labor force | age 20-64, the demographic groups most similar to Immigrants from Lithuania are Immigrants from Ireland (80.7%, a difference of 0.010%), Immigrants from South Central Asia (80.7%, a difference of 0.020%), Immigrants from North Macedonia (80.7%, a difference of 0.020%), Immigrants from Uganda (80.7%, a difference of 0.040%), and Chinese (80.7%, a difference of 0.040%).
| Demographics | Rating | Rank | In Labor Force | Age 20-64 |
| Immigrants | Morocco | 100.0 /100 | #24 | Exceptional 80.8% |
| Kenyans | 100.0 /100 | #25 | Exceptional 80.8% |
| Immigrants | Serbia | 100.0 /100 | #26 | Exceptional 80.8% |
| Immigrants | Kenya | 99.9 /100 | #27 | Exceptional 80.7% |
| Immigrants | Uganda | 99.9 /100 | #28 | Exceptional 80.7% |
| Immigrants | South Central Asia | 99.9 /100 | #29 | Exceptional 80.7% |
| Immigrants | North Macedonia | 99.9 /100 | #30 | Exceptional 80.7% |
| Immigrants | Lithuania | 99.9 /100 | #31 | Exceptional 80.7% |
| Immigrants | Ireland | 99.9 /100 | #32 | Exceptional 80.7% |
| Chinese | 99.9 /100 | #33 | Exceptional 80.7% |
| Immigrants | Brazil | 99.9 /100 | #34 | Exceptional 80.7% |
| Immigrants | Poland | 99.9 /100 | #35 | Exceptional 80.6% |
| Paraguayans | 99.8 /100 | #36 | Exceptional 80.6% |
| Immigrants | Moldova | 99.8 /100 | #37 | Exceptional 80.6% |
| Ugandans | 99.8 /100 | #38 | Exceptional 80.6% |