Sioux vs Immigrants from Lithuania In Labor Force | Age 20-64
COMPARE
Sioux
Immigrants from Lithuania
In Labor Force | Age 20-64
In Labor Force | Age 20-64 Comparison
Sioux
Immigrants from Lithuania
75.0%
IN LABOR FORCE | AGE 20-64
0.0/ 100
METRIC RATING
327th/ 347
METRIC RANK
80.7%
IN LABOR FORCE | AGE 20-64
99.9/ 100
METRIC RATING
31st/ 347
METRIC RANK
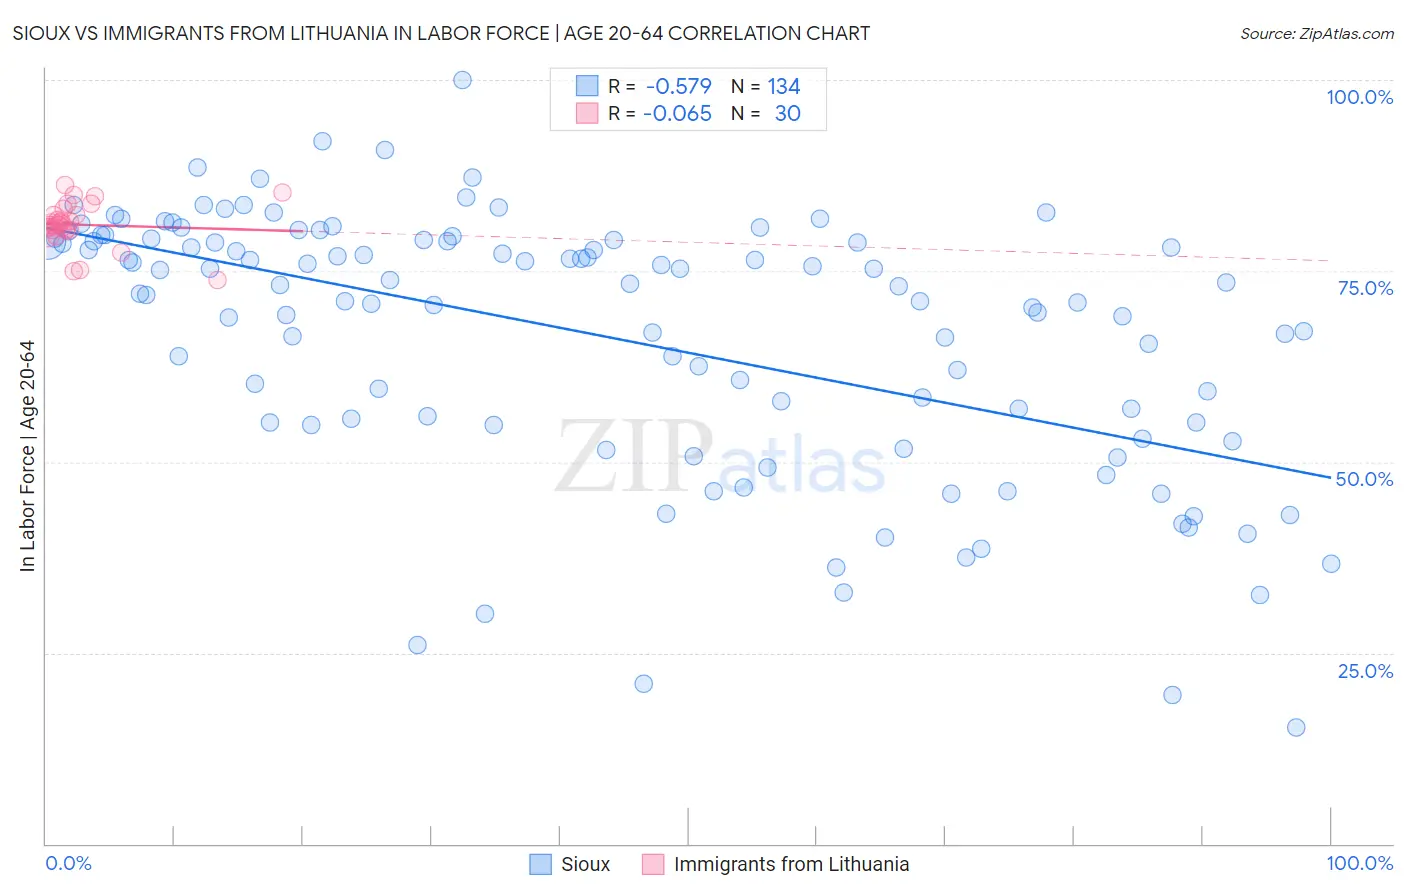
Sioux vs Immigrants from Lithuania In Labor Force | Age 20-64 Correlation Chart
The statistical analysis conducted on geographies consisting of 234,178,381 people shows a substantial negative correlation between the proportion of Sioux and labor force participation rate among population between the ages 20 and 64 in the United States with a correlation coefficient (R) of -0.579 and weighted average of 75.0%. Similarly, the statistical analysis conducted on geographies consisting of 117,724,932 people shows a slight negative correlation between the proportion of Immigrants from Lithuania and labor force participation rate among population between the ages 20 and 64 in the United States with a correlation coefficient (R) of -0.065 and weighted average of 80.7%, a difference of 7.6%.
In Labor Force | Age 20-64 Correlation Summary
| Measurement | Sioux | Immigrants from Lithuania |
| Minimum | 15.2% | 73.8% |
| Maximum | 100.0% | 86.3% |
| Range | 84.8% | 12.5% |
| Mean | 66.4% | 81.1% |
| Median | 72.5% | 81.0% |
| Interquartile 25% (IQ1) | 55.2% | 80.4% |
| Interquartile 75% (IQ3) | 79.0% | 82.3% |
| Interquartile Range (IQR) | 23.8% | 2.0% |
| Standard Deviation (Sample) | 17.0% | 2.9% |
| Standard Deviation (Population) | 17.0% | 2.8% |
Similar Demographics by In Labor Force | Age 20-64
Demographics Similar to Sioux by In Labor Force | Age 20-64
In terms of in labor force | age 20-64, the demographic groups most similar to Sioux are Kiowa (75.0%, a difference of 0.030%), Creek (75.1%, a difference of 0.18%), Cheyenne (74.8%, a difference of 0.23%), Colville (74.8%, a difference of 0.29%), and Menominee (75.3%, a difference of 0.40%).
| Demographics | Rating | Rank | In Labor Force | Age 20-64 |
| Yakama | 0.0 /100 | #320 | Tragic 75.8% |
| Seminole | 0.0 /100 | #321 | Tragic 75.5% |
| Dutch West Indians | 0.0 /100 | #322 | Tragic 75.5% |
| Cajuns | 0.0 /100 | #323 | Tragic 75.5% |
| Choctaw | 0.0 /100 | #324 | Tragic 75.4% |
| Menominee | 0.0 /100 | #325 | Tragic 75.3% |
| Creek | 0.0 /100 | #326 | Tragic 75.1% |
| Sioux | 0.0 /100 | #327 | Tragic 75.0% |
| Kiowa | 0.0 /100 | #328 | Tragic 75.0% |
| Cheyenne | 0.0 /100 | #329 | Tragic 74.8% |
| Colville | 0.0 /100 | #330 | Tragic 74.8% |
| Paiute | 0.0 /100 | #331 | Tragic 74.7% |
| Arapaho | 0.0 /100 | #332 | Tragic 74.4% |
| Natives/Alaskans | 0.0 /100 | #333 | Tragic 73.9% |
| Apache | 0.0 /100 | #334 | Tragic 73.7% |
Demographics Similar to Immigrants from Lithuania by In Labor Force | Age 20-64
In terms of in labor force | age 20-64, the demographic groups most similar to Immigrants from Lithuania are Immigrants from Ireland (80.7%, a difference of 0.010%), Immigrants from South Central Asia (80.7%, a difference of 0.020%), Immigrants from North Macedonia (80.7%, a difference of 0.020%), Immigrants from Uganda (80.7%, a difference of 0.040%), and Chinese (80.7%, a difference of 0.040%).
| Demographics | Rating | Rank | In Labor Force | Age 20-64 |
| Immigrants | Morocco | 100.0 /100 | #24 | Exceptional 80.8% |
| Kenyans | 100.0 /100 | #25 | Exceptional 80.8% |
| Immigrants | Serbia | 100.0 /100 | #26 | Exceptional 80.8% |
| Immigrants | Kenya | 99.9 /100 | #27 | Exceptional 80.7% |
| Immigrants | Uganda | 99.9 /100 | #28 | Exceptional 80.7% |
| Immigrants | South Central Asia | 99.9 /100 | #29 | Exceptional 80.7% |
| Immigrants | North Macedonia | 99.9 /100 | #30 | Exceptional 80.7% |
| Immigrants | Lithuania | 99.9 /100 | #31 | Exceptional 80.7% |
| Immigrants | Ireland | 99.9 /100 | #32 | Exceptional 80.7% |
| Chinese | 99.9 /100 | #33 | Exceptional 80.7% |
| Immigrants | Brazil | 99.9 /100 | #34 | Exceptional 80.7% |
| Immigrants | Poland | 99.9 /100 | #35 | Exceptional 80.6% |
| Paraguayans | 99.8 /100 | #36 | Exceptional 80.6% |
| Immigrants | Moldova | 99.8 /100 | #37 | Exceptional 80.6% |
| Ugandans | 99.8 /100 | #38 | Exceptional 80.6% |