Asian vs Guatemalan In Labor Force | Age 20-64
COMPARE
Asian
Guatemalan
In Labor Force | Age 20-64
In Labor Force | Age 20-64 Comparison
Asians
Guatemalans
80.2%
IN LABOR FORCE | AGE 20-64
97.7/ 100
METRIC RATING
79th/ 347
METRIC RANK
78.7%
IN LABOR FORCE | AGE 20-64
0.4/ 100
METRIC RATING
257th/ 347
METRIC RANK
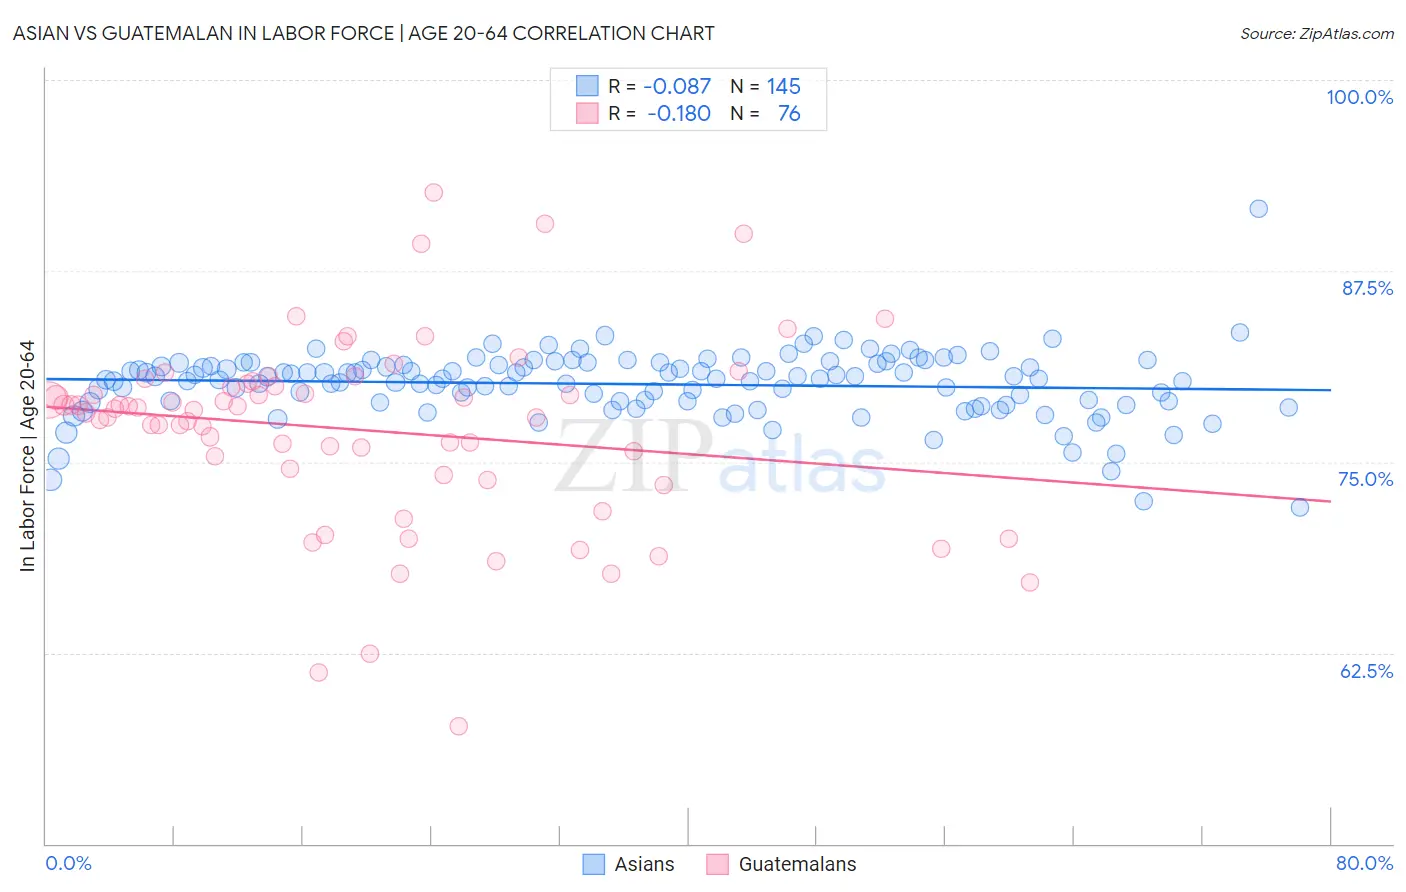
Asian vs Guatemalan In Labor Force | Age 20-64 Correlation Chart
The statistical analysis conducted on geographies consisting of 550,934,136 people shows a slight negative correlation between the proportion of Asians and labor force participation rate among population between the ages 20 and 64 in the United States with a correlation coefficient (R) of -0.087 and weighted average of 80.2%. Similarly, the statistical analysis conducted on geographies consisting of 409,569,156 people shows a poor negative correlation between the proportion of Guatemalans and labor force participation rate among population between the ages 20 and 64 in the United States with a correlation coefficient (R) of -0.180 and weighted average of 78.7%, a difference of 1.8%.
In Labor Force | Age 20-64 Correlation Summary
| Measurement | Asian | Guatemalan |
| Minimum | 72.0% | 57.7% |
| Maximum | 91.6% | 92.6% |
| Range | 19.6% | 34.9% |
| Mean | 80.1% | 77.1% |
| Median | 80.5% | 78.4% |
| Interquartile 25% (IQ1) | 78.9% | 74.4% |
| Interquartile 75% (IQ3) | 81.4% | 80.0% |
| Interquartile Range (IQR) | 2.5% | 5.7% |
| Standard Deviation (Sample) | 2.2% | 6.2% |
| Standard Deviation (Population) | 2.2% | 6.2% |
Similar Demographics by In Labor Force | Age 20-64
Demographics Similar to Asians by In Labor Force | Age 20-64
In terms of in labor force | age 20-64, the demographic groups most similar to Asians are Egyptian (80.2%, a difference of 0.010%), Immigrants from Colombia (80.2%, a difference of 0.010%), Immigrants from Romania (80.2%, a difference of 0.010%), Immigrants from Croatia (80.1%, a difference of 0.010%), and Immigrants from Afghanistan (80.2%, a difference of 0.030%).
| Demographics | Rating | Rank | In Labor Force | Age 20-64 |
| Eastern Europeans | 98.4 /100 | #72 | Exceptional 80.2% |
| Cypriots | 98.2 /100 | #73 | Exceptional 80.2% |
| Immigrants | Eastern Europe | 98.1 /100 | #74 | Exceptional 80.2% |
| Immigrants | Afghanistan | 97.9 /100 | #75 | Exceptional 80.2% |
| Egyptians | 97.8 /100 | #76 | Exceptional 80.2% |
| Immigrants | Colombia | 97.8 /100 | #77 | Exceptional 80.2% |
| Immigrants | Romania | 97.8 /100 | #78 | Exceptional 80.2% |
| Asians | 97.7 /100 | #79 | Exceptional 80.2% |
| Immigrants | Croatia | 97.6 /100 | #80 | Exceptional 80.1% |
| German Russians | 97.3 /100 | #81 | Exceptional 80.1% |
| Immigrants | Japan | 97.3 /100 | #82 | Exceptional 80.1% |
| Colombians | 97.3 /100 | #83 | Exceptional 80.1% |
| Immigrants | Latvia | 97.2 /100 | #84 | Exceptional 80.1% |
| Jordanians | 97.2 /100 | #85 | Exceptional 80.1% |
| Immigrants | Egypt | 97.1 /100 | #86 | Exceptional 80.1% |
Demographics Similar to Guatemalans by In Labor Force | Age 20-64
In terms of in labor force | age 20-64, the demographic groups most similar to Guatemalans are Immigrants from Guatemala (78.7%, a difference of 0.0%), Hawaiian (78.7%, a difference of 0.020%), Celtic (78.7%, a difference of 0.020%), Basque (78.7%, a difference of 0.040%), and Immigrants from Lebanon (78.7%, a difference of 0.040%).
| Demographics | Rating | Rank | In Labor Force | Age 20-64 |
| Hondurans | 0.8 /100 | #250 | Tragic 78.8% |
| Barbadians | 0.7 /100 | #251 | Tragic 78.8% |
| Immigrants | Honduras | 0.6 /100 | #252 | Tragic 78.7% |
| Basques | 0.5 /100 | #253 | Tragic 78.7% |
| Immigrants | Lebanon | 0.5 /100 | #254 | Tragic 78.7% |
| Hawaiians | 0.5 /100 | #255 | Tragic 78.7% |
| Celtics | 0.5 /100 | #256 | Tragic 78.7% |
| Guatemalans | 0.4 /100 | #257 | Tragic 78.7% |
| Immigrants | Guatemala | 0.4 /100 | #258 | Tragic 78.7% |
| Tsimshian | 0.4 /100 | #259 | Tragic 78.7% |
| Immigrants | Fiji | 0.3 /100 | #260 | Tragic 78.6% |
| Whites/Caucasians | 0.2 /100 | #261 | Tragic 78.5% |
| Fijians | 0.1 /100 | #262 | Tragic 78.4% |
| Pennsylvania Germans | 0.1 /100 | #263 | Tragic 78.4% |
| Spaniards | 0.1 /100 | #264 | Tragic 78.4% |