Asian vs Cajun In Labor Force | Age 20-64
COMPARE
Asian
Cajun
In Labor Force | Age 20-64
In Labor Force | Age 20-64 Comparison
Asians
Cajuns
80.2%
IN LABOR FORCE | AGE 20-64
97.7/ 100
METRIC RATING
79th/ 347
METRIC RANK
75.5%
IN LABOR FORCE | AGE 20-64
0.0/ 100
METRIC RATING
323rd/ 347
METRIC RANK
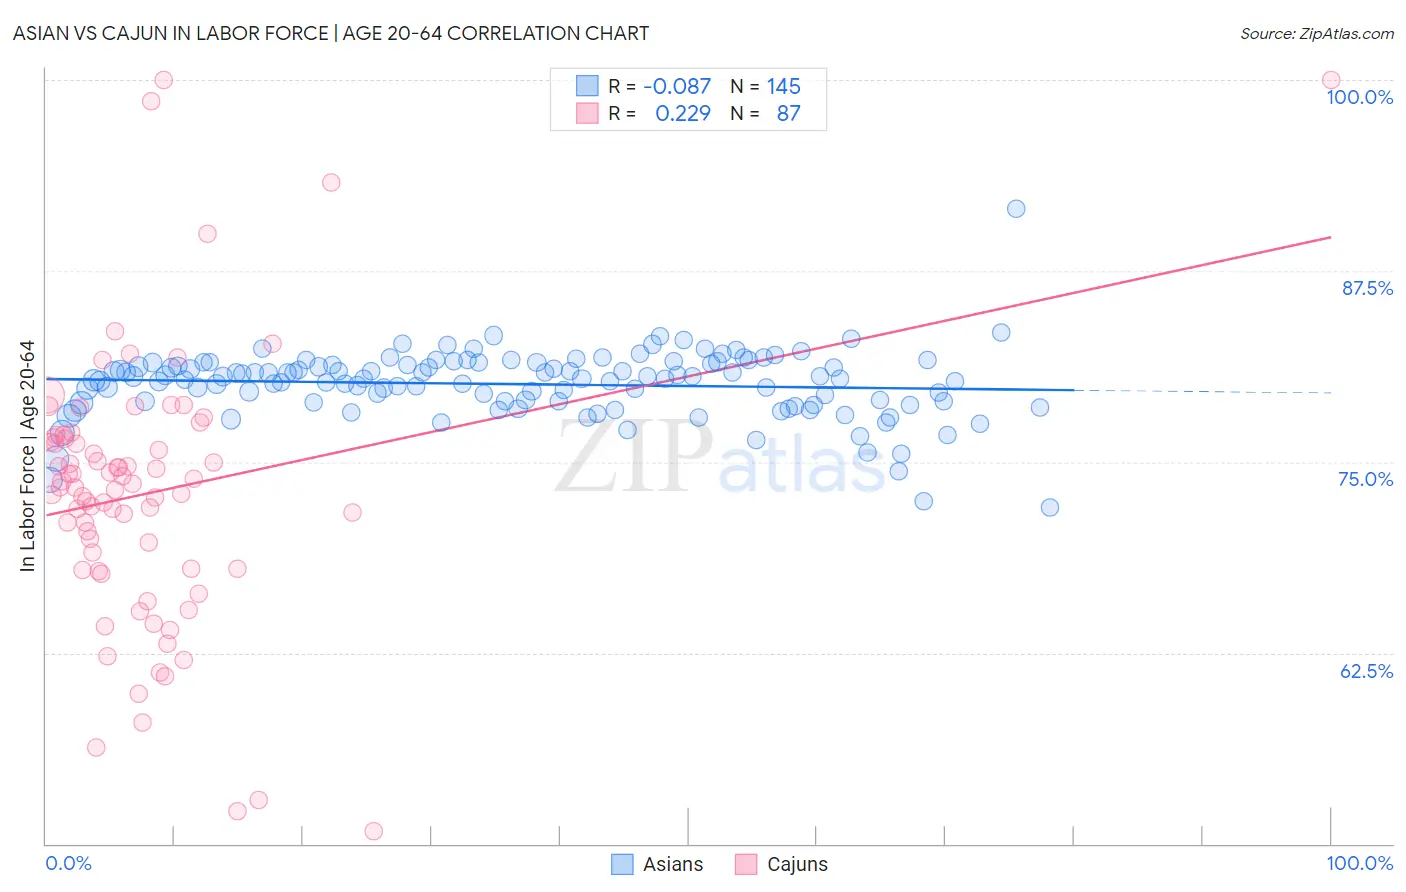
Asian vs Cajun In Labor Force | Age 20-64 Correlation Chart
The statistical analysis conducted on geographies consisting of 550,934,136 people shows a slight negative correlation between the proportion of Asians and labor force participation rate among population between the ages 20 and 64 in the United States with a correlation coefficient (R) of -0.087 and weighted average of 80.2%. Similarly, the statistical analysis conducted on geographies consisting of 149,713,173 people shows a weak positive correlation between the proportion of Cajuns and labor force participation rate among population between the ages 20 and 64 in the United States with a correlation coefficient (R) of 0.229 and weighted average of 75.5%, a difference of 6.2%.
In Labor Force | Age 20-64 Correlation Summary
| Measurement | Asian | Cajun |
| Minimum | 72.0% | 50.8% |
| Maximum | 91.6% | 100.0% |
| Range | 19.6% | 49.2% |
| Mean | 80.1% | 72.9% |
| Median | 80.5% | 73.4% |
| Interquartile 25% (IQ1) | 78.9% | 68.0% |
| Interquartile 75% (IQ3) | 81.4% | 76.6% |
| Interquartile Range (IQR) | 2.5% | 8.6% |
| Standard Deviation (Sample) | 2.2% | 9.0% |
| Standard Deviation (Population) | 2.2% | 8.9% |
Similar Demographics by In Labor Force | Age 20-64
Demographics Similar to Asians by In Labor Force | Age 20-64
In terms of in labor force | age 20-64, the demographic groups most similar to Asians are Egyptian (80.2%, a difference of 0.010%), Immigrants from Colombia (80.2%, a difference of 0.010%), Immigrants from Romania (80.2%, a difference of 0.010%), Immigrants from Croatia (80.1%, a difference of 0.010%), and Immigrants from Afghanistan (80.2%, a difference of 0.030%).
| Demographics | Rating | Rank | In Labor Force | Age 20-64 |
| Eastern Europeans | 98.4 /100 | #72 | Exceptional 80.2% |
| Cypriots | 98.2 /100 | #73 | Exceptional 80.2% |
| Immigrants | Eastern Europe | 98.1 /100 | #74 | Exceptional 80.2% |
| Immigrants | Afghanistan | 97.9 /100 | #75 | Exceptional 80.2% |
| Egyptians | 97.8 /100 | #76 | Exceptional 80.2% |
| Immigrants | Colombia | 97.8 /100 | #77 | Exceptional 80.2% |
| Immigrants | Romania | 97.8 /100 | #78 | Exceptional 80.2% |
| Asians | 97.7 /100 | #79 | Exceptional 80.2% |
| Immigrants | Croatia | 97.6 /100 | #80 | Exceptional 80.1% |
| German Russians | 97.3 /100 | #81 | Exceptional 80.1% |
| Immigrants | Japan | 97.3 /100 | #82 | Exceptional 80.1% |
| Colombians | 97.3 /100 | #83 | Exceptional 80.1% |
| Immigrants | Latvia | 97.2 /100 | #84 | Exceptional 80.1% |
| Jordanians | 97.2 /100 | #85 | Exceptional 80.1% |
| Immigrants | Egypt | 97.1 /100 | #86 | Exceptional 80.1% |
Demographics Similar to Cajuns by In Labor Force | Age 20-64
In terms of in labor force | age 20-64, the demographic groups most similar to Cajuns are Dutch West Indian (75.5%, a difference of 0.040%), Choctaw (75.4%, a difference of 0.060%), Seminole (75.5%, a difference of 0.090%), Menominee (75.3%, a difference of 0.19%), and Creek (75.1%, a difference of 0.42%).
| Demographics | Rating | Rank | In Labor Force | Age 20-64 |
| Yaqui | 0.0 /100 | #316 | Tragic 76.5% |
| Cherokee | 0.0 /100 | #317 | Tragic 76.2% |
| Chickasaw | 0.0 /100 | #318 | Tragic 76.2% |
| Inupiat | 0.0 /100 | #319 | Tragic 76.1% |
| Yakama | 0.0 /100 | #320 | Tragic 75.8% |
| Seminole | 0.0 /100 | #321 | Tragic 75.5% |
| Dutch West Indians | 0.0 /100 | #322 | Tragic 75.5% |
| Cajuns | 0.0 /100 | #323 | Tragic 75.5% |
| Choctaw | 0.0 /100 | #324 | Tragic 75.4% |
| Menominee | 0.0 /100 | #325 | Tragic 75.3% |
| Creek | 0.0 /100 | #326 | Tragic 75.1% |
| Sioux | 0.0 /100 | #327 | Tragic 75.0% |
| Kiowa | 0.0 /100 | #328 | Tragic 75.0% |
| Cheyenne | 0.0 /100 | #329 | Tragic 74.8% |
| Colville | 0.0 /100 | #330 | Tragic 74.8% |