Immigrants from Thailand vs Immigrants from Lithuania In Labor Force | Age 20-64
COMPARE
Immigrants from Thailand
Immigrants from Lithuania
In Labor Force | Age 20-64
In Labor Force | Age 20-64 Comparison
Immigrants from Thailand
Immigrants from Lithuania
79.4%
IN LABOR FORCE | AGE 20-64
24.8/ 100
METRIC RATING
194th/ 347
METRIC RANK
80.7%
IN LABOR FORCE | AGE 20-64
99.9/ 100
METRIC RATING
31st/ 347
METRIC RANK
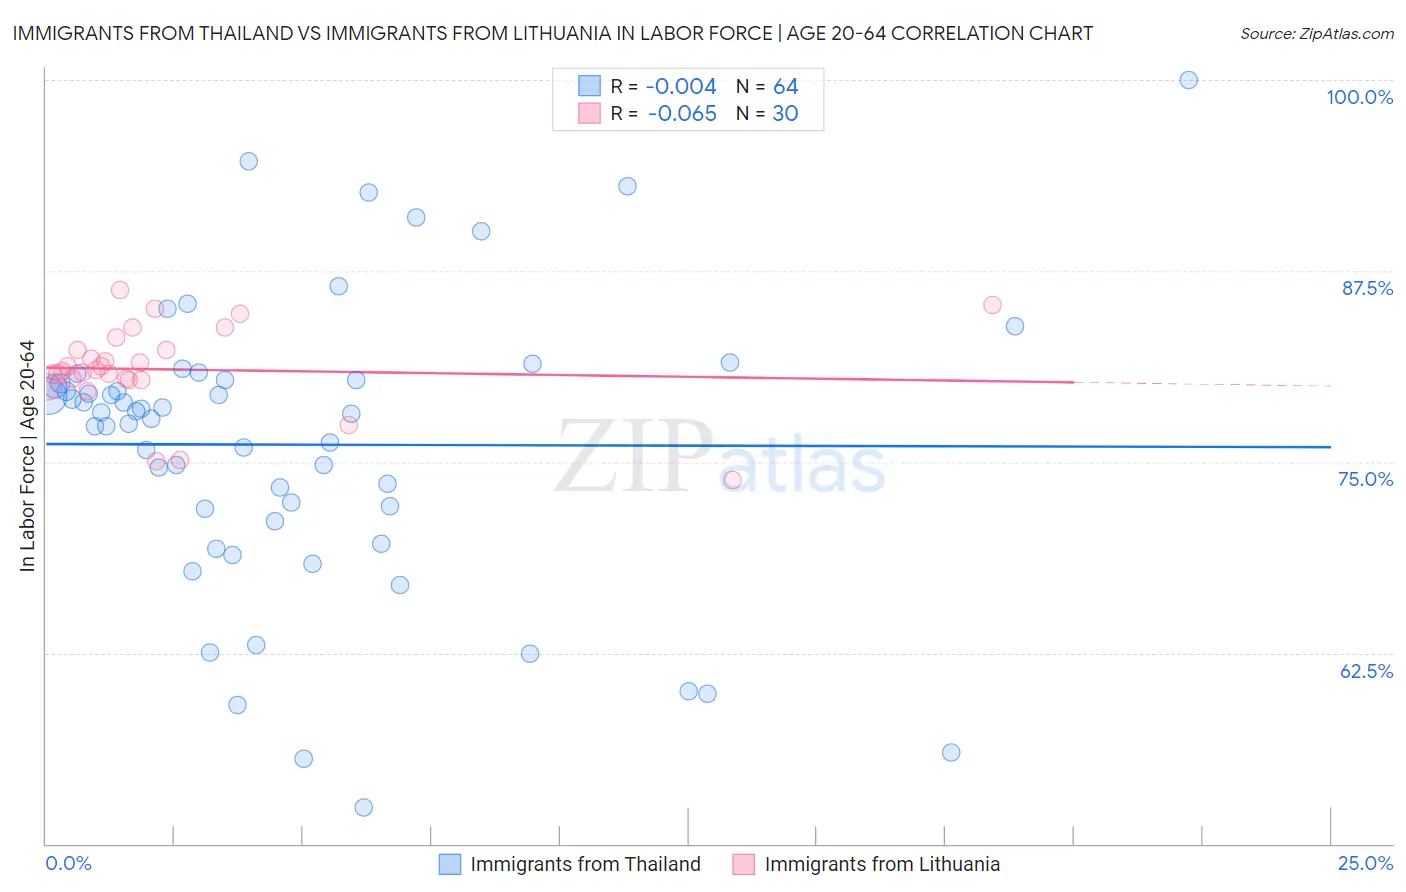
Immigrants from Thailand vs Immigrants from Lithuania In Labor Force | Age 20-64 Correlation Chart
The statistical analysis conducted on geographies consisting of 317,022,892 people shows no correlation between the proportion of Immigrants from Thailand and labor force participation rate among population between the ages 20 and 64 in the United States with a correlation coefficient (R) of -0.004 and weighted average of 79.4%. Similarly, the statistical analysis conducted on geographies consisting of 117,724,932 people shows a slight negative correlation between the proportion of Immigrants from Lithuania and labor force participation rate among population between the ages 20 and 64 in the United States with a correlation coefficient (R) of -0.065 and weighted average of 80.7%, a difference of 1.7%.
In Labor Force | Age 20-64 Correlation Summary
| Measurement | Immigrants from Thailand | Immigrants from Lithuania |
| Minimum | 52.4% | 73.8% |
| Maximum | 100.0% | 86.3% |
| Range | 47.6% | 12.5% |
| Mean | 76.1% | 81.1% |
| Median | 78.2% | 81.0% |
| Interquartile 25% (IQ1) | 71.5% | 80.4% |
| Interquartile 75% (IQ3) | 80.4% | 82.3% |
| Interquartile Range (IQR) | 8.9% | 2.0% |
| Standard Deviation (Sample) | 9.5% | 2.9% |
| Standard Deviation (Population) | 9.5% | 2.8% |
Similar Demographics by In Labor Force | Age 20-64
Demographics Similar to Immigrants from Thailand by In Labor Force | Age 20-64
In terms of in labor force | age 20-64, the demographic groups most similar to Immigrants from Thailand are Indonesian (79.4%, a difference of 0.010%), Immigrants from Austria (79.4%, a difference of 0.010%), Immigrants from Denmark (79.4%, a difference of 0.020%), Ecuadorian (79.4%, a difference of 0.020%), and Immigrants from Senegal (79.4%, a difference of 0.020%).
| Demographics | Rating | Rank | In Labor Force | Age 20-64 |
| Assyrians/Chaldeans/Syriacs | 33.3 /100 | #187 | Fair 79.4% |
| Immigrants | Haiti | 32.1 /100 | #188 | Fair 79.4% |
| Immigrants | El Salvador | 30.9 /100 | #189 | Fair 79.4% |
| Immigrants | Syria | 30.8 /100 | #190 | Fair 79.4% |
| Swiss | 28.9 /100 | #191 | Fair 79.4% |
| Immigrants | Denmark | 26.9 /100 | #192 | Fair 79.4% |
| Indonesians | 26.1 /100 | #193 | Fair 79.4% |
| Immigrants | Thailand | 24.8 /100 | #194 | Fair 79.4% |
| Immigrants | Austria | 23.7 /100 | #195 | Fair 79.4% |
| Ecuadorians | 23.1 /100 | #196 | Fair 79.4% |
| Immigrants | Senegal | 22.5 /100 | #197 | Fair 79.4% |
| Immigrants | Laos | 21.5 /100 | #198 | Fair 79.4% |
| Dutch | 20.2 /100 | #199 | Fair 79.3% |
| Immigrants | Oceania | 19.1 /100 | #200 | Poor 79.3% |
| Immigrants | Nicaragua | 19.0 /100 | #201 | Poor 79.3% |
Demographics Similar to Immigrants from Lithuania by In Labor Force | Age 20-64
In terms of in labor force | age 20-64, the demographic groups most similar to Immigrants from Lithuania are Immigrants from Ireland (80.7%, a difference of 0.010%), Immigrants from South Central Asia (80.7%, a difference of 0.020%), Immigrants from North Macedonia (80.7%, a difference of 0.020%), Immigrants from Uganda (80.7%, a difference of 0.040%), and Chinese (80.7%, a difference of 0.040%).
| Demographics | Rating | Rank | In Labor Force | Age 20-64 |
| Immigrants | Morocco | 100.0 /100 | #24 | Exceptional 80.8% |
| Kenyans | 100.0 /100 | #25 | Exceptional 80.8% |
| Immigrants | Serbia | 100.0 /100 | #26 | Exceptional 80.8% |
| Immigrants | Kenya | 99.9 /100 | #27 | Exceptional 80.7% |
| Immigrants | Uganda | 99.9 /100 | #28 | Exceptional 80.7% |
| Immigrants | South Central Asia | 99.9 /100 | #29 | Exceptional 80.7% |
| Immigrants | North Macedonia | 99.9 /100 | #30 | Exceptional 80.7% |
| Immigrants | Lithuania | 99.9 /100 | #31 | Exceptional 80.7% |
| Immigrants | Ireland | 99.9 /100 | #32 | Exceptional 80.7% |
| Chinese | 99.9 /100 | #33 | Exceptional 80.7% |
| Immigrants | Brazil | 99.9 /100 | #34 | Exceptional 80.7% |
| Immigrants | Poland | 99.9 /100 | #35 | Exceptional 80.6% |
| Paraguayans | 99.8 /100 | #36 | Exceptional 80.6% |
| Immigrants | Moldova | 99.8 /100 | #37 | Exceptional 80.6% |
| Ugandans | 99.8 /100 | #38 | Exceptional 80.6% |