Welsh vs Immigrants from Lithuania In Labor Force | Age 20-64
COMPARE
Welsh
Immigrants from Lithuania
In Labor Force | Age 20-64
In Labor Force | Age 20-64 Comparison
Welsh
Immigrants from Lithuania
79.0%
IN LABOR FORCE | AGE 20-64
2.4/ 100
METRIC RATING
239th/ 347
METRIC RANK
80.7%
IN LABOR FORCE | AGE 20-64
99.9/ 100
METRIC RATING
31st/ 347
METRIC RANK
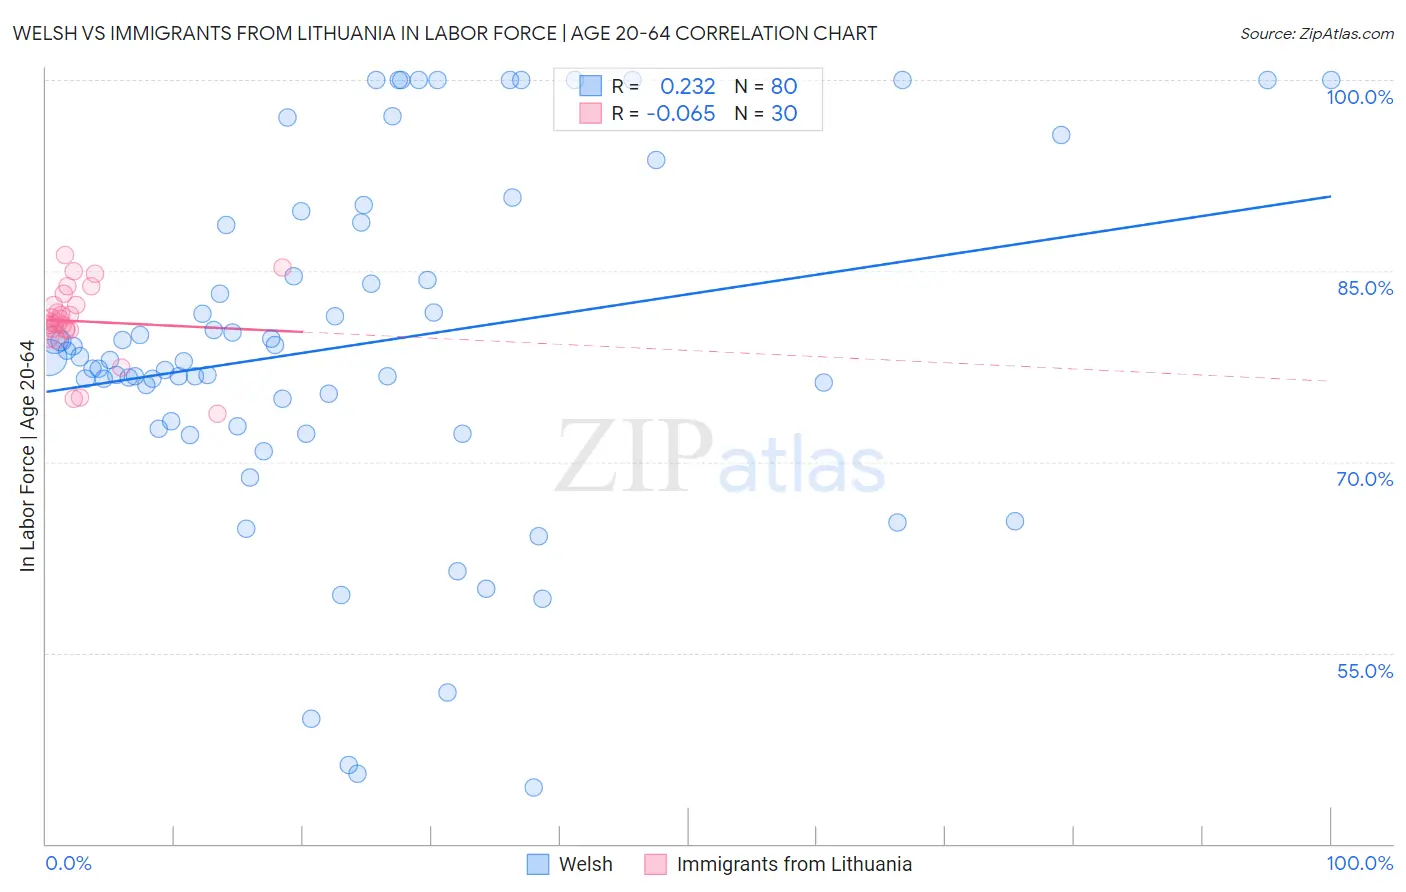
Welsh vs Immigrants from Lithuania In Labor Force | Age 20-64 Correlation Chart
The statistical analysis conducted on geographies consisting of 528,606,062 people shows a weak positive correlation between the proportion of Welsh and labor force participation rate among population between the ages 20 and 64 in the United States with a correlation coefficient (R) of 0.232 and weighted average of 79.0%. Similarly, the statistical analysis conducted on geographies consisting of 117,724,932 people shows a slight negative correlation between the proportion of Immigrants from Lithuania and labor force participation rate among population between the ages 20 and 64 in the United States with a correlation coefficient (R) of -0.065 and weighted average of 80.7%, a difference of 2.2%.
In Labor Force | Age 20-64 Correlation Summary
| Measurement | Welsh | Immigrants from Lithuania |
| Minimum | 44.4% | 73.8% |
| Maximum | 100.0% | 86.3% |
| Range | 55.6% | 12.5% |
| Mean | 79.2% | 81.1% |
| Median | 78.1% | 81.0% |
| Interquartile 25% (IQ1) | 73.0% | 80.4% |
| Interquartile 75% (IQ3) | 88.7% | 82.3% |
| Interquartile Range (IQR) | 15.7% | 2.0% |
| Standard Deviation (Sample) | 13.7% | 2.9% |
| Standard Deviation (Population) | 13.6% | 2.8% |
Similar Demographics by In Labor Force | Age 20-64
Demographics Similar to Welsh by In Labor Force | Age 20-64
In terms of in labor force | age 20-64, the demographic groups most similar to Welsh are Trinidadian and Tobagonian (79.0%, a difference of 0.010%), Immigrants from Jamaica (79.0%, a difference of 0.020%), Samoan (79.0%, a difference of 0.040%), Immigrants from North America (79.0%, a difference of 0.040%), and Jamaican (78.9%, a difference of 0.040%).
| Demographics | Rating | Rank | In Labor Force | Age 20-64 |
| Guamanians/Chamorros | 4.5 /100 | #232 | Tragic 79.1% |
| Japanese | 4.0 /100 | #233 | Tragic 79.1% |
| Immigrants | Canada | 3.2 /100 | #234 | Tragic 79.0% |
| Tlingit-Haida | 3.2 /100 | #235 | Tragic 79.0% |
| Samoans | 2.9 /100 | #236 | Tragic 79.0% |
| Immigrants | North America | 2.9 /100 | #237 | Tragic 79.0% |
| Immigrants | Jamaica | 2.6 /100 | #238 | Tragic 79.0% |
| Welsh | 2.4 /100 | #239 | Tragic 79.0% |
| Trinidadians and Tobagonians | 2.3 /100 | #240 | Tragic 79.0% |
| Jamaicans | 2.0 /100 | #241 | Tragic 78.9% |
| Immigrants | Micronesia | 1.9 /100 | #242 | Tragic 78.9% |
| Immigrants | West Indies | 1.7 /100 | #243 | Tragic 78.9% |
| French | 1.5 /100 | #244 | Tragic 78.9% |
| Scottish | 1.3 /100 | #245 | Tragic 78.9% |
| Immigrants | Trinidad and Tobago | 1.1 /100 | #246 | Tragic 78.8% |
Demographics Similar to Immigrants from Lithuania by In Labor Force | Age 20-64
In terms of in labor force | age 20-64, the demographic groups most similar to Immigrants from Lithuania are Immigrants from Ireland (80.7%, a difference of 0.010%), Immigrants from South Central Asia (80.7%, a difference of 0.020%), Immigrants from North Macedonia (80.7%, a difference of 0.020%), Immigrants from Uganda (80.7%, a difference of 0.040%), and Chinese (80.7%, a difference of 0.040%).
| Demographics | Rating | Rank | In Labor Force | Age 20-64 |
| Immigrants | Morocco | 100.0 /100 | #24 | Exceptional 80.8% |
| Kenyans | 100.0 /100 | #25 | Exceptional 80.8% |
| Immigrants | Serbia | 100.0 /100 | #26 | Exceptional 80.8% |
| Immigrants | Kenya | 99.9 /100 | #27 | Exceptional 80.7% |
| Immigrants | Uganda | 99.9 /100 | #28 | Exceptional 80.7% |
| Immigrants | South Central Asia | 99.9 /100 | #29 | Exceptional 80.7% |
| Immigrants | North Macedonia | 99.9 /100 | #30 | Exceptional 80.7% |
| Immigrants | Lithuania | 99.9 /100 | #31 | Exceptional 80.7% |
| Immigrants | Ireland | 99.9 /100 | #32 | Exceptional 80.7% |
| Chinese | 99.9 /100 | #33 | Exceptional 80.7% |
| Immigrants | Brazil | 99.9 /100 | #34 | Exceptional 80.7% |
| Immigrants | Poland | 99.9 /100 | #35 | Exceptional 80.6% |
| Paraguayans | 99.8 /100 | #36 | Exceptional 80.6% |
| Immigrants | Moldova | 99.8 /100 | #37 | Exceptional 80.6% |
| Ugandans | 99.8 /100 | #38 | Exceptional 80.6% |