Asian vs Venezuelan In Labor Force | Age 20-64
COMPARE
Asian
Venezuelan
In Labor Force | Age 20-64
In Labor Force | Age 20-64 Comparison
Asians
Venezuelans
80.2%
IN LABOR FORCE | AGE 20-64
97.7/ 100
METRIC RATING
79th/ 347
METRIC RANK
80.0%
IN LABOR FORCE | AGE 20-64
95.3/ 100
METRIC RATING
104th/ 347
METRIC RANK
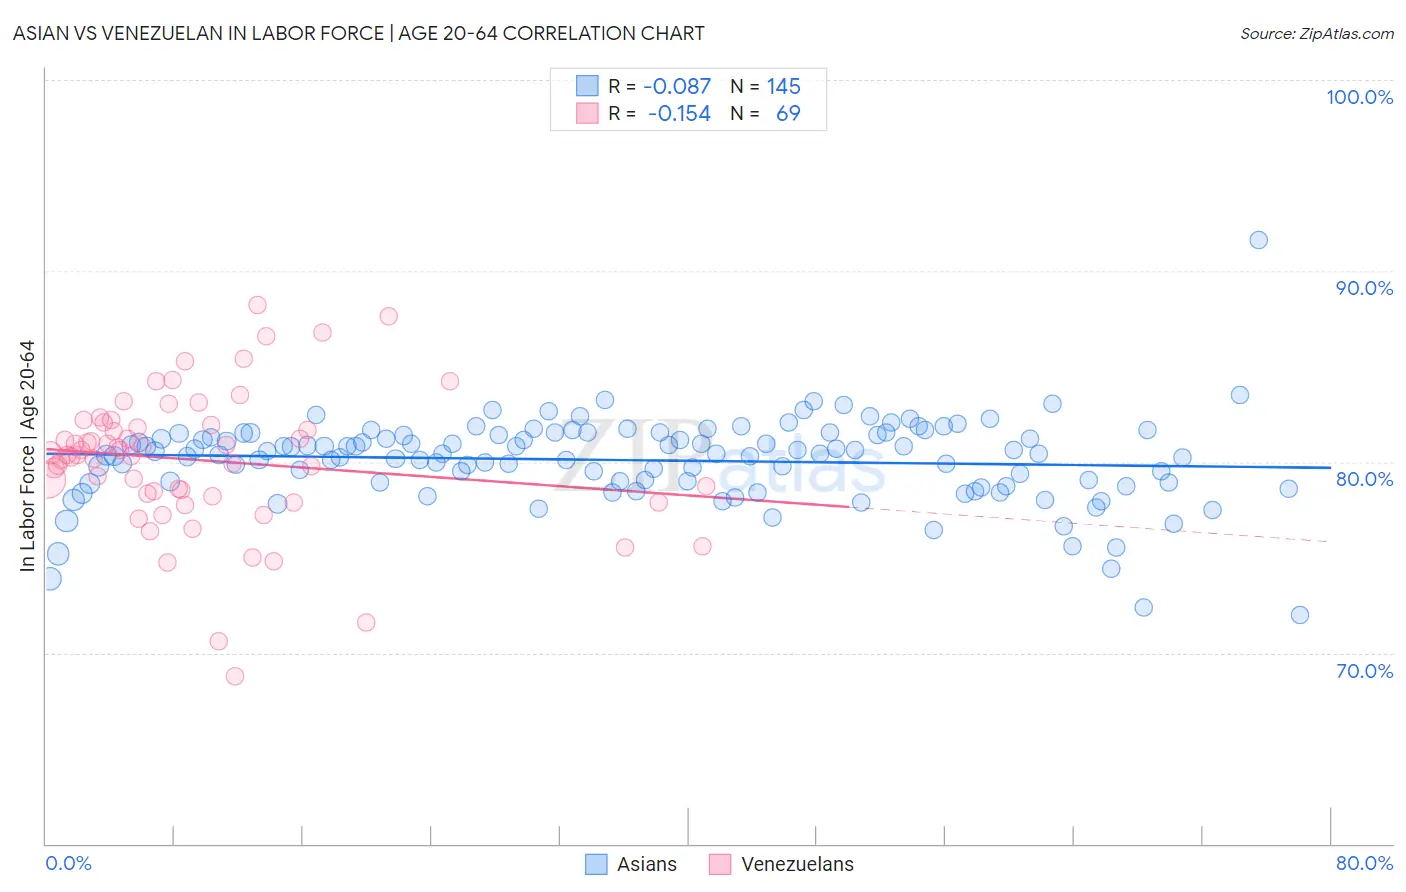
Asian vs Venezuelan In Labor Force | Age 20-64 Correlation Chart
The statistical analysis conducted on geographies consisting of 550,934,136 people shows a slight negative correlation between the proportion of Asians and labor force participation rate among population between the ages 20 and 64 in the United States with a correlation coefficient (R) of -0.087 and weighted average of 80.2%. Similarly, the statistical analysis conducted on geographies consisting of 306,339,015 people shows a poor negative correlation between the proportion of Venezuelans and labor force participation rate among population between the ages 20 and 64 in the United States with a correlation coefficient (R) of -0.154 and weighted average of 80.0%, a difference of 0.15%.
In Labor Force | Age 20-64 Correlation Summary
| Measurement | Asian | Venezuelan |
| Minimum | 72.0% | 68.8% |
| Maximum | 91.6% | 88.2% |
| Range | 19.6% | 19.4% |
| Mean | 80.1% | 80.1% |
| Median | 80.5% | 80.4% |
| Interquartile 25% (IQ1) | 78.9% | 78.3% |
| Interquartile 75% (IQ3) | 81.4% | 82.0% |
| Interquartile Range (IQR) | 2.5% | 3.7% |
| Standard Deviation (Sample) | 2.2% | 3.6% |
| Standard Deviation (Population) | 2.2% | 3.6% |
Similar Demographics by In Labor Force | Age 20-64
Demographics Similar to Asians by In Labor Force | Age 20-64
In terms of in labor force | age 20-64, the demographic groups most similar to Asians are Egyptian (80.2%, a difference of 0.010%), Immigrants from Colombia (80.2%, a difference of 0.010%), Immigrants from Romania (80.2%, a difference of 0.010%), Immigrants from Croatia (80.1%, a difference of 0.010%), and Immigrants from Afghanistan (80.2%, a difference of 0.030%).
| Demographics | Rating | Rank | In Labor Force | Age 20-64 |
| Eastern Europeans | 98.4 /100 | #72 | Exceptional 80.2% |
| Cypriots | 98.2 /100 | #73 | Exceptional 80.2% |
| Immigrants | Eastern Europe | 98.1 /100 | #74 | Exceptional 80.2% |
| Immigrants | Afghanistan | 97.9 /100 | #75 | Exceptional 80.2% |
| Egyptians | 97.8 /100 | #76 | Exceptional 80.2% |
| Immigrants | Colombia | 97.8 /100 | #77 | Exceptional 80.2% |
| Immigrants | Romania | 97.8 /100 | #78 | Exceptional 80.2% |
| Asians | 97.7 /100 | #79 | Exceptional 80.2% |
| Immigrants | Croatia | 97.6 /100 | #80 | Exceptional 80.1% |
| German Russians | 97.3 /100 | #81 | Exceptional 80.1% |
| Immigrants | Japan | 97.3 /100 | #82 | Exceptional 80.1% |
| Colombians | 97.3 /100 | #83 | Exceptional 80.1% |
| Immigrants | Latvia | 97.2 /100 | #84 | Exceptional 80.1% |
| Jordanians | 97.2 /100 | #85 | Exceptional 80.1% |
| Immigrants | Egypt | 97.1 /100 | #86 | Exceptional 80.1% |
Demographics Similar to Venezuelans by In Labor Force | Age 20-64
In terms of in labor force | age 20-64, the demographic groups most similar to Venezuelans are Filipino (80.1%, a difference of 0.010%), Palestinian (80.0%, a difference of 0.010%), Immigrants from Australia (80.0%, a difference of 0.010%), Russian (80.0%, a difference of 0.010%), and Immigrants from Ghana (80.0%, a difference of 0.010%).
| Demographics | Rating | Rank | In Labor Force | Age 20-64 |
| South Americans | 95.9 /100 | #97 | Exceptional 80.1% |
| Immigrants | Uruguay | 95.8 /100 | #98 | Exceptional 80.1% |
| Immigrants | Chile | 95.7 /100 | #99 | Exceptional 80.1% |
| Filipinos | 95.6 /100 | #100 | Exceptional 80.1% |
| Palestinians | 95.5 /100 | #101 | Exceptional 80.0% |
| Immigrants | Australia | 95.5 /100 | #102 | Exceptional 80.0% |
| Russians | 95.5 /100 | #103 | Exceptional 80.0% |
| Venezuelans | 95.3 /100 | #104 | Exceptional 80.0% |
| Immigrants | Ghana | 95.0 /100 | #105 | Exceptional 80.0% |
| Greeks | 94.8 /100 | #106 | Exceptional 80.0% |
| Immigrants | Jordan | 94.8 /100 | #107 | Exceptional 80.0% |
| Iranians | 94.3 /100 | #108 | Exceptional 80.0% |
| Immigrants | Argentina | 94.1 /100 | #109 | Exceptional 80.0% |
| Estonians | 94.0 /100 | #110 | Exceptional 80.0% |
| Immigrants | South America | 93.9 /100 | #111 | Exceptional 80.0% |