Armenian vs Nigerian In Labor Force | Age 20-64
COMPARE
Armenian
Nigerian
In Labor Force | Age 20-64
In Labor Force | Age 20-64 Comparison
Armenians
Nigerians
79.5%
IN LABOR FORCE | AGE 20-64
41.4/ 100
METRIC RATING
179th/ 347
METRIC RANK
79.7%
IN LABOR FORCE | AGE 20-64
64.0/ 100
METRIC RATING
165th/ 347
METRIC RANK
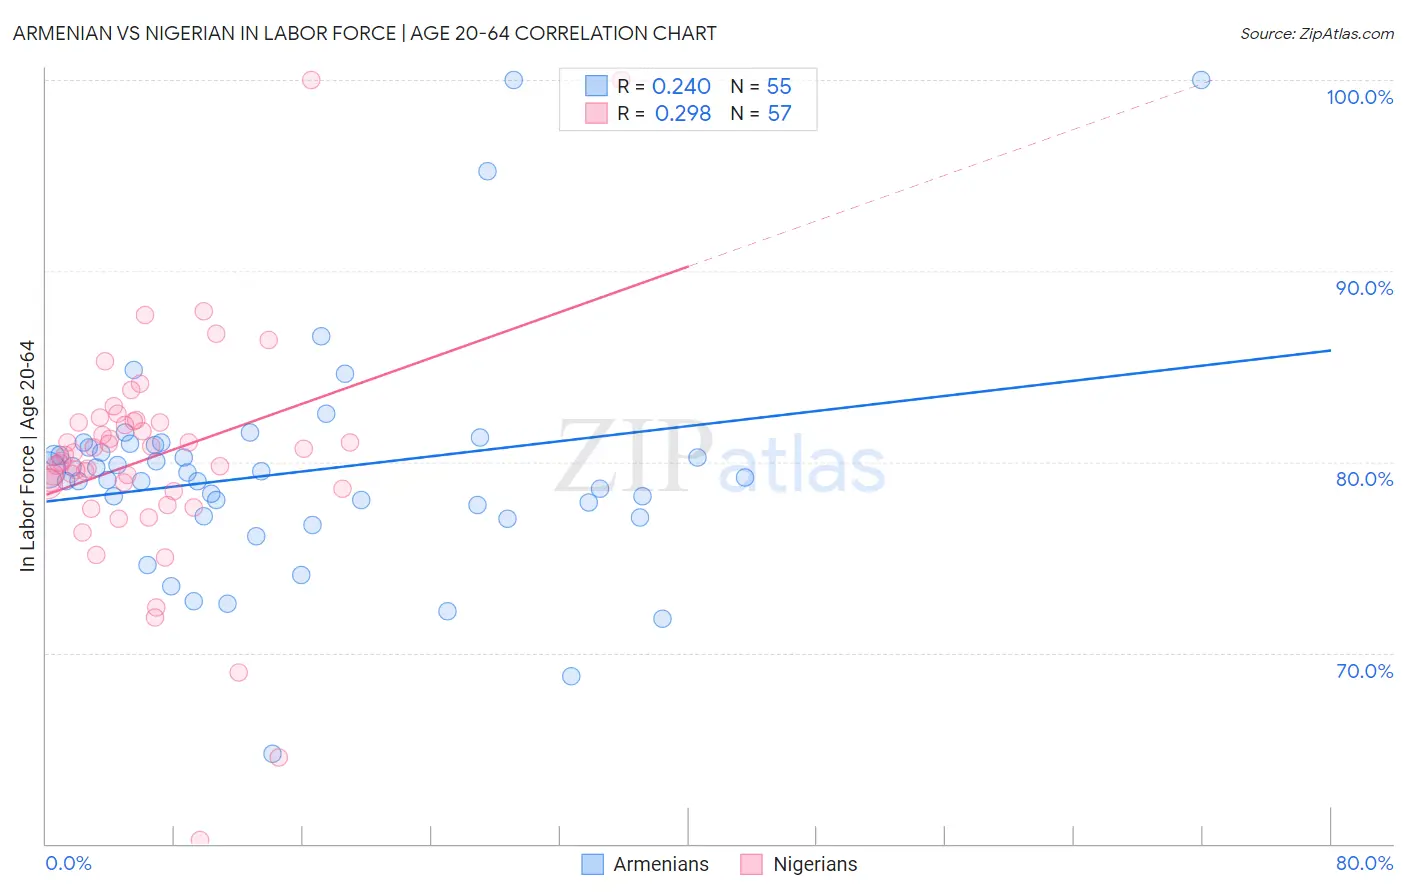
Armenian vs Nigerian In Labor Force | Age 20-64 Correlation Chart
The statistical analysis conducted on geographies consisting of 310,959,496 people shows a weak positive correlation between the proportion of Armenians and labor force participation rate among population between the ages 20 and 64 in the United States with a correlation coefficient (R) of 0.240 and weighted average of 79.5%. Similarly, the statistical analysis conducted on geographies consisting of 332,789,973 people shows a weak positive correlation between the proportion of Nigerians and labor force participation rate among population between the ages 20 and 64 in the United States with a correlation coefficient (R) of 0.298 and weighted average of 79.7%, a difference of 0.19%.
In Labor Force | Age 20-64 Correlation Summary
| Measurement | Armenian | Nigerian |
| Minimum | 64.7% | 60.2% |
| Maximum | 100.0% | 100.0% |
| Range | 35.3% | 39.8% |
| Mean | 79.5% | 80.2% |
| Median | 79.2% | 80.4% |
| Interquartile 25% (IQ1) | 77.1% | 78.5% |
| Interquartile 75% (IQ3) | 80.9% | 82.1% |
| Interquartile Range (IQR) | 3.7% | 3.6% |
| Standard Deviation (Sample) | 5.9% | 6.1% |
| Standard Deviation (Population) | 5.9% | 6.1% |
Demographics Similar to Armenians and Nigerians by In Labor Force | Age 20-64
In terms of in labor force | age 20-64, the demographic groups most similar to Armenians are Salvadoran (79.5%, a difference of 0.0%), Czechoslovakian (79.5%, a difference of 0.020%), Immigrants from Netherlands (79.5%, a difference of 0.030%), Immigrants from Saudi Arabia (79.5%, a difference of 0.030%), and Cuban (79.5%, a difference of 0.040%). Similarly, the demographic groups most similar to Nigerians are Immigrants from Costa Rica (79.7%, a difference of 0.0%), Immigrants from Burma/Myanmar (79.7%, a difference of 0.0%), German (79.7%, a difference of 0.010%), Okinawan (79.6%, a difference of 0.010%), and Immigrants from Iraq (79.6%, a difference of 0.020%).
| Demographics | Rating | Rank | In Labor Force | Age 20-64 |
| Germans | 65.2 /100 | #162 | Good 79.7% |
| Immigrants | Costa Rica | 64.6 /100 | #163 | Good 79.7% |
| Immigrants | Burma/Myanmar | 64.4 /100 | #164 | Good 79.7% |
| Nigerians | 64.0 /100 | #165 | Good 79.7% |
| Okinawans | 62.7 /100 | #166 | Good 79.6% |
| Immigrants | Iraq | 62.0 /100 | #167 | Good 79.6% |
| Immigrants | Indonesia | 61.8 /100 | #168 | Good 79.6% |
| Laotians | 58.4 /100 | #169 | Average 79.6% |
| Slavs | 54.0 /100 | #170 | Average 79.6% |
| Immigrants | Switzerland | 53.3 /100 | #171 | Average 79.6% |
| Immigrants | Belgium | 53.1 /100 | #172 | Average 79.6% |
| Immigrants | Scotland | 52.4 /100 | #173 | Average 79.6% |
| Syrians | 50.0 /100 | #174 | Average 79.6% |
| Cubans | 46.1 /100 | #175 | Average 79.5% |
| Australians | 46.0 /100 | #176 | Average 79.5% |
| Immigrants | Netherlands | 45.2 /100 | #177 | Average 79.5% |
| Czechoslovakians | 44.3 /100 | #178 | Average 79.5% |
| Armenians | 41.4 /100 | #179 | Average 79.5% |
| Salvadorans | 41.0 /100 | #180 | Average 79.5% |
| Immigrants | Saudi Arabia | 37.7 /100 | #181 | Fair 79.5% |
| Malaysians | 37.1 /100 | #182 | Fair 79.5% |