Russian vs Immigrants from India In Labor Force | Age 16-19
COMPARE
Russian
Immigrants from India
In Labor Force | Age 16-19
In Labor Force | Age 16-19 Comparison
Russians
Immigrants from India
36.7%
IN LABOR FORCE | AGE 16-19
57.5/ 100
METRIC RATING
173rd/ 347
METRIC RANK
35.0%
IN LABOR FORCE | AGE 16-19
3.5/ 100
METRIC RATING
237th/ 347
METRIC RANK
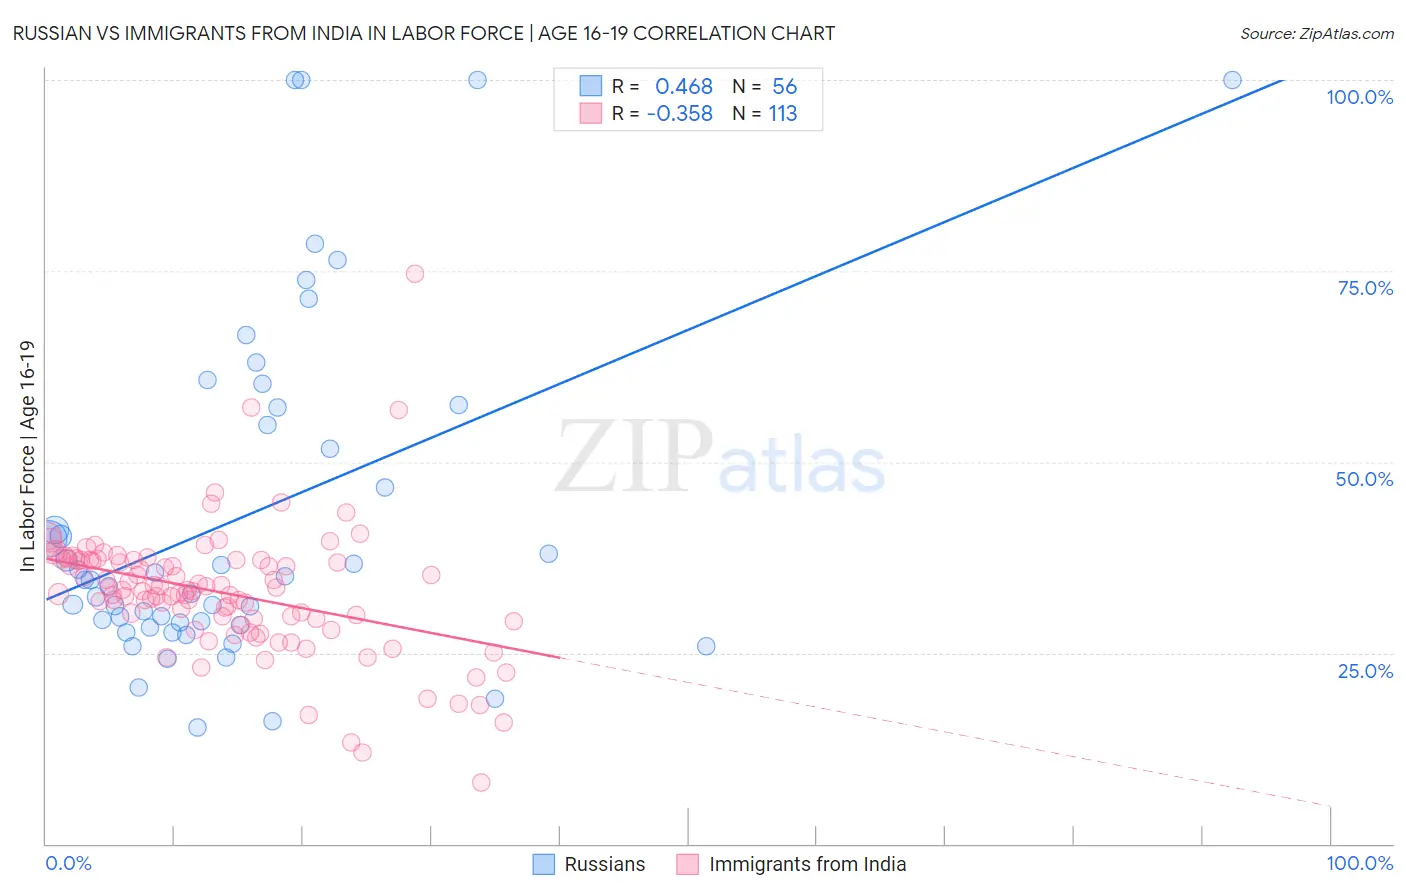
Russian vs Immigrants from India In Labor Force | Age 16-19 Correlation Chart
The statistical analysis conducted on geographies consisting of 510,287,384 people shows a moderate positive correlation between the proportion of Russians and labor force participation rate among population between the ages 16 and 19 in the United States with a correlation coefficient (R) of 0.468 and weighted average of 36.7%. Similarly, the statistical analysis conducted on geographies consisting of 433,366,164 people shows a mild negative correlation between the proportion of Immigrants from India and labor force participation rate among population between the ages 16 and 19 in the United States with a correlation coefficient (R) of -0.358 and weighted average of 35.0%, a difference of 4.8%.
In Labor Force | Age 16-19 Correlation Summary
| Measurement | Russian | Immigrants from India |
| Minimum | 15.3% | 8.1% |
| Maximum | 100.0% | 74.6% |
| Range | 84.7% | 66.5% |
| Mean | 42.9% | 32.9% |
| Median | 34.6% | 33.1% |
| Interquartile 25% (IQ1) | 28.8% | 29.2% |
| Interquartile 75% (IQ3) | 56.0% | 37.2% |
| Interquartile Range (IQR) | 27.2% | 8.0% |
| Standard Deviation (Sample) | 22.2% | 8.5% |
| Standard Deviation (Population) | 22.0% | 8.5% |
Similar Demographics by In Labor Force | Age 16-19
Demographics Similar to Russians by In Labor Force | Age 16-19
In terms of in labor force | age 16-19, the demographic groups most similar to Russians are Immigrants from Cambodia (36.7%, a difference of 0.040%), South African (36.7%, a difference of 0.040%), Immigrants from South Africa (36.8%, a difference of 0.15%), Immigrants from Latvia (36.8%, a difference of 0.21%), and Palestinian (36.8%, a difference of 0.29%).
| Demographics | Rating | Rank | In Labor Force | Age 16-19 |
| Immigrants | Western Africa | 66.7 /100 | #166 | Good 36.9% |
| Arabs | 63.6 /100 | #167 | Good 36.8% |
| Palestinians | 63.1 /100 | #168 | Good 36.8% |
| Immigrants | Latvia | 61.6 /100 | #169 | Good 36.8% |
| Immigrants | South Africa | 60.5 /100 | #170 | Good 36.8% |
| Immigrants | Cambodia | 58.4 /100 | #171 | Average 36.7% |
| South Africans | 58.3 /100 | #172 | Average 36.7% |
| Russians | 57.5 /100 | #173 | Average 36.7% |
| Immigrants | Czechoslovakia | 50.0 /100 | #174 | Average 36.6% |
| Natives/Alaskans | 49.0 /100 | #175 | Average 36.6% |
| Albanians | 48.8 /100 | #176 | Average 36.5% |
| Immigrants | Northern Europe | 46.6 /100 | #177 | Average 36.5% |
| Blacks/African Americans | 45.1 /100 | #178 | Average 36.5% |
| Immigrants | Southern Europe | 43.3 /100 | #179 | Average 36.4% |
| Immigrants | Morocco | 41.1 /100 | #180 | Average 36.4% |
Demographics Similar to Immigrants from India by In Labor Force | Age 16-19
In terms of in labor force | age 16-19, the demographic groups most similar to Immigrants from India are Immigrants from Australia (35.1%, a difference of 0.030%), Immigrants from Vietnam (35.0%, a difference of 0.050%), Inupiat (35.0%, a difference of 0.14%), Immigrants from Philippines (35.1%, a difference of 0.17%), and Immigrants from Central America (35.0%, a difference of 0.23%).
| Demographics | Rating | Rank | In Labor Force | Age 16-19 |
| Immigrants | Honduras | 4.9 /100 | #230 | Tragic 35.2% |
| Immigrants | Syria | 4.5 /100 | #231 | Tragic 35.2% |
| Immigrants | Kazakhstan | 4.5 /100 | #232 | Tragic 35.2% |
| Immigrants | France | 4.3 /100 | #233 | Tragic 35.1% |
| Immigrants | Mexico | 4.2 /100 | #234 | Tragic 35.1% |
| Immigrants | Philippines | 4.0 /100 | #235 | Tragic 35.1% |
| Immigrants | Australia | 3.6 /100 | #236 | Tragic 35.1% |
| Immigrants | India | 3.5 /100 | #237 | Tragic 35.0% |
| Immigrants | Vietnam | 3.4 /100 | #238 | Tragic 35.0% |
| Inupiat | 3.2 /100 | #239 | Tragic 35.0% |
| Immigrants | Central America | 3.0 /100 | #240 | Tragic 35.0% |
| Immigrants | Ireland | 2.9 /100 | #241 | Tragic 35.0% |
| Uruguayans | 2.6 /100 | #242 | Tragic 34.9% |
| Pueblo | 2.6 /100 | #243 | Tragic 34.9% |
| Immigrants | Turkey | 2.6 /100 | #244 | Tragic 34.9% |