Armenian vs Lebanese In Labor Force | Age 16-19
COMPARE
Armenian
Lebanese
In Labor Force | Age 16-19
In Labor Force | Age 16-19 Comparison
Armenians
Lebanese
32.9%
IN LABOR FORCE | AGE 16-19
0.0/ 100
METRIC RATING
299th/ 347
METRIC RANK
38.6%
IN LABOR FORCE | AGE 16-19
98.7/ 100
METRIC RATING
109th/ 347
METRIC RANK
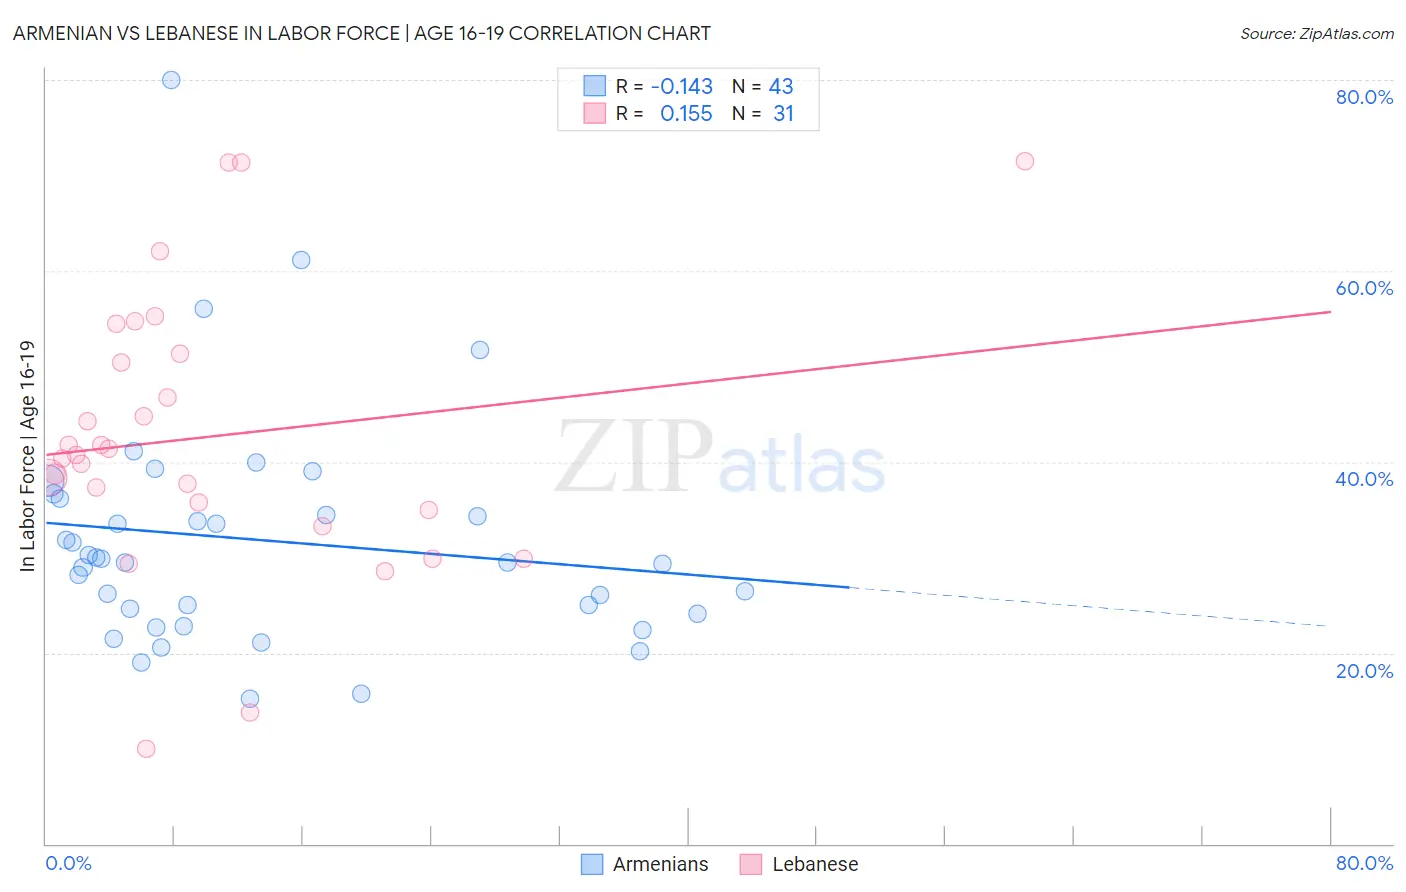
Armenian vs Lebanese In Labor Force | Age 16-19 Correlation Chart
The statistical analysis conducted on geographies consisting of 310,493,407 people shows a poor negative correlation between the proportion of Armenians and labor force participation rate among population between the ages 16 and 19 in the United States with a correlation coefficient (R) of -0.143 and weighted average of 32.9%. Similarly, the statistical analysis conducted on geographies consisting of 401,057,064 people shows a poor positive correlation between the proportion of Lebanese and labor force participation rate among population between the ages 16 and 19 in the United States with a correlation coefficient (R) of 0.155 and weighted average of 38.6%, a difference of 17.1%.
In Labor Force | Age 16-19 Correlation Summary
| Measurement | Armenian | Lebanese |
| Minimum | 15.3% | 10.0% |
| Maximum | 80.0% | 71.5% |
| Range | 64.7% | 61.5% |
| Mean | 31.8% | 42.6% |
| Median | 29.5% | 40.7% |
| Interquartile 25% (IQ1) | 24.1% | 34.9% |
| Interquartile 75% (IQ3) | 36.2% | 51.3% |
| Interquartile Range (IQR) | 12.1% | 16.4% |
| Standard Deviation (Sample) | 12.3% | 14.6% |
| Standard Deviation (Population) | 12.1% | 14.3% |
Similar Demographics by In Labor Force | Age 16-19
Demographics Similar to Armenians by In Labor Force | Age 16-19
In terms of in labor force | age 16-19, the demographic groups most similar to Armenians are Immigrants from Argentina (32.9%, a difference of 0.15%), Iranian (33.0%, a difference of 0.24%), Okinawan (32.8%, a difference of 0.39%), Belizean (32.8%, a difference of 0.53%), and Immigrants from Haiti (33.2%, a difference of 0.75%).
| Demographics | Rating | Rank | In Labor Force | Age 16-19 |
| Haitians | 0.1 /100 | #292 | Tragic 33.4% |
| Immigrants | South America | 0.1 /100 | #293 | Tragic 33.3% |
| Argentineans | 0.1 /100 | #294 | Tragic 33.3% |
| Yup'ik | 0.1 /100 | #295 | Tragic 33.3% |
| Jamaicans | 0.1 /100 | #296 | Tragic 33.2% |
| Immigrants | Haiti | 0.1 /100 | #297 | Tragic 33.2% |
| Iranians | 0.0 /100 | #298 | Tragic 33.0% |
| Armenians | 0.0 /100 | #299 | Tragic 32.9% |
| Immigrants | Argentina | 0.0 /100 | #300 | Tragic 32.9% |
| Okinawans | 0.0 /100 | #301 | Tragic 32.8% |
| Belizeans | 0.0 /100 | #302 | Tragic 32.8% |
| Immigrants | Dominica | 0.0 /100 | #303 | Tragic 32.5% |
| Israelis | 0.0 /100 | #304 | Tragic 32.4% |
| Nicaraguans | 0.0 /100 | #305 | Tragic 32.4% |
| Spanish American Indians | 0.0 /100 | #306 | Tragic 32.4% |
Demographics Similar to Lebanese by In Labor Force | Age 16-19
In terms of in labor force | age 16-19, the demographic groups most similar to Lebanese are Immigrants from Ethiopia (38.6%, a difference of 0.0%), Chinese (38.6%, a difference of 0.10%), Maltese (38.5%, a difference of 0.12%), Delaware (38.6%, a difference of 0.13%), and Iraqi (38.6%, a difference of 0.15%).
| Demographics | Rating | Rank | In Labor Force | Age 16-19 |
| Zimbabweans | 99.1 /100 | #102 | Exceptional 38.7% |
| Immigrants | Cameroon | 99.0 /100 | #103 | Exceptional 38.7% |
| Immigrants | Eritrea | 99.0 /100 | #104 | Exceptional 38.7% |
| Iraqis | 98.9 /100 | #105 | Exceptional 38.6% |
| Delaware | 98.8 /100 | #106 | Exceptional 38.6% |
| Chinese | 98.8 /100 | #107 | Exceptional 38.6% |
| Immigrants | Ethiopia | 98.7 /100 | #108 | Exceptional 38.6% |
| Lebanese | 98.7 /100 | #109 | Exceptional 38.6% |
| Maltese | 98.6 /100 | #110 | Exceptional 38.5% |
| Crow | 98.5 /100 | #111 | Exceptional 38.5% |
| Immigrants | Scotland | 98.5 /100 | #112 | Exceptional 38.5% |
| Sub-Saharan Africans | 98.3 /100 | #113 | Exceptional 38.4% |
| Hawaiians | 98.2 /100 | #114 | Exceptional 38.4% |
| Bulgarians | 97.9 /100 | #115 | Exceptional 38.3% |
| Colville | 97.9 /100 | #116 | Exceptional 38.3% |