Menominee vs Immigrants from India In Labor Force | Age 16-19
COMPARE
Menominee
Immigrants from India
In Labor Force | Age 16-19
In Labor Force | Age 16-19 Comparison
Menominee
Immigrants from India
33.9%
IN LABOR FORCE | AGE 16-19
0.3/ 100
METRIC RATING
277th/ 347
METRIC RANK
35.0%
IN LABOR FORCE | AGE 16-19
3.5/ 100
METRIC RATING
237th/ 347
METRIC RANK
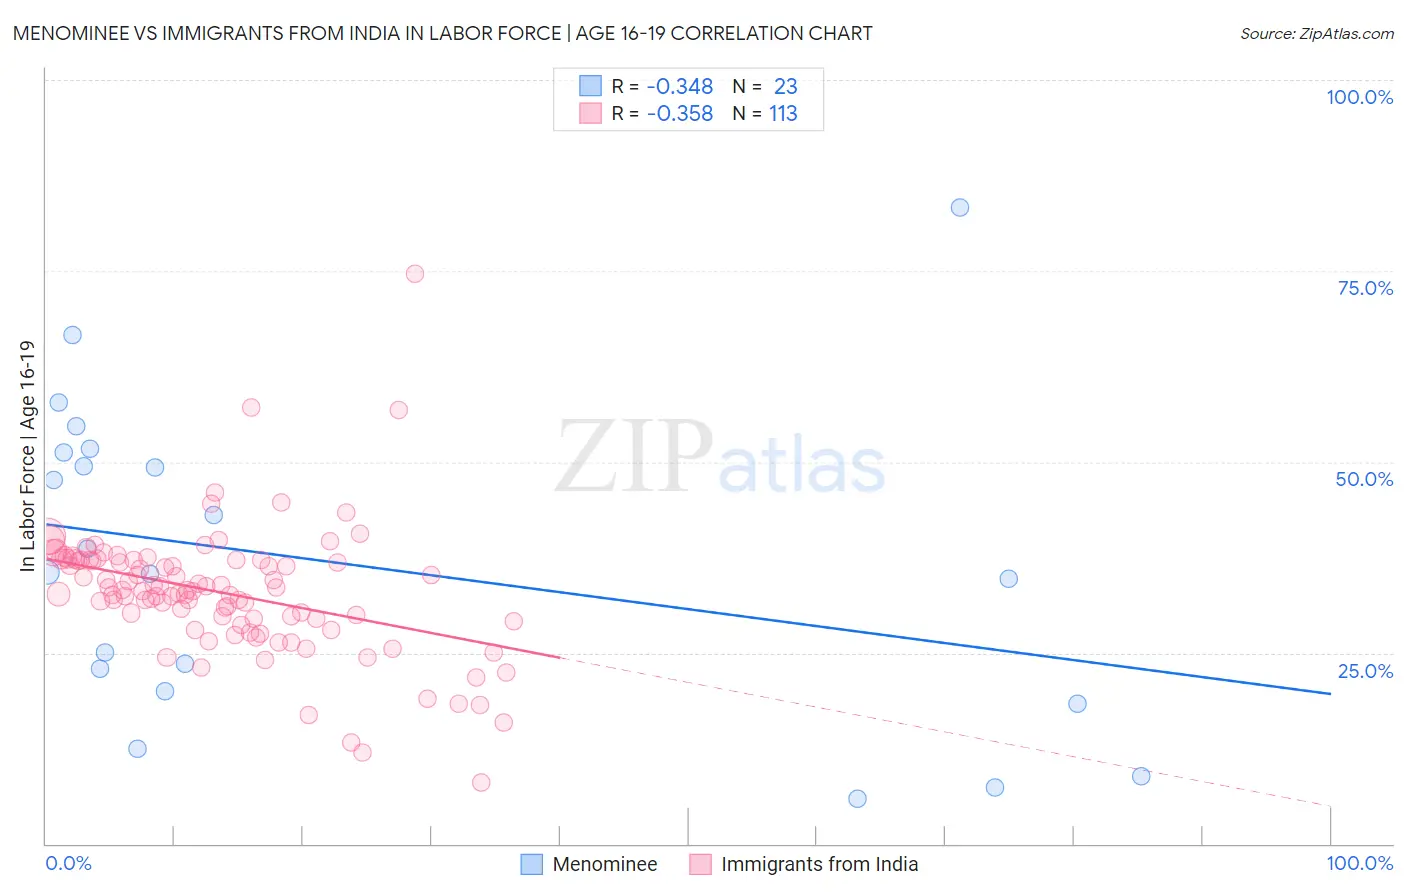
Menominee vs Immigrants from India In Labor Force | Age 16-19 Correlation Chart
The statistical analysis conducted on geographies consisting of 45,771,172 people shows a mild negative correlation between the proportion of Menominee and labor force participation rate among population between the ages 16 and 19 in the United States with a correlation coefficient (R) of -0.348 and weighted average of 33.9%. Similarly, the statistical analysis conducted on geographies consisting of 433,366,164 people shows a mild negative correlation between the proportion of Immigrants from India and labor force participation rate among population between the ages 16 and 19 in the United States with a correlation coefficient (R) of -0.358 and weighted average of 35.0%, a difference of 3.5%.
In Labor Force | Age 16-19 Correlation Summary
| Measurement | Menominee | Immigrants from India |
| Minimum | 5.9% | 8.1% |
| Maximum | 83.3% | 74.6% |
| Range | 77.4% | 66.5% |
| Mean | 36.7% | 32.9% |
| Median | 35.5% | 33.1% |
| Interquartile 25% (IQ1) | 20.0% | 29.2% |
| Interquartile 75% (IQ3) | 51.3% | 37.2% |
| Interquartile Range (IQR) | 31.3% | 8.0% |
| Standard Deviation (Sample) | 20.3% | 8.5% |
| Standard Deviation (Population) | 19.8% | 8.5% |
Similar Demographics by In Labor Force | Age 16-19
Demographics Similar to Menominee by In Labor Force | Age 16-19
In terms of in labor force | age 16-19, the demographic groups most similar to Menominee are Colombian (33.8%, a difference of 0.070%), Paraguayan (33.8%, a difference of 0.080%), Taiwanese (33.8%, a difference of 0.090%), Cypriot (33.8%, a difference of 0.10%), and Immigrants from Latin America (33.9%, a difference of 0.11%).
| Demographics | Rating | Rank | In Labor Force | Age 16-19 |
| Immigrants | Russia | 0.4 /100 | #270 | Tragic 34.1% |
| Central American Indians | 0.4 /100 | #271 | Tragic 34.1% |
| Asians | 0.4 /100 | #272 | Tragic 34.1% |
| Immigrants | Panama | 0.4 /100 | #273 | Tragic 34.0% |
| Venezuelans | 0.3 /100 | #274 | Tragic 34.0% |
| Immigrants | Fiji | 0.3 /100 | #275 | Tragic 33.9% |
| Immigrants | Latin America | 0.3 /100 | #276 | Tragic 33.9% |
| Menominee | 0.3 /100 | #277 | Tragic 33.9% |
| Colombians | 0.3 /100 | #278 | Tragic 33.8% |
| Paraguayans | 0.3 /100 | #279 | Tragic 33.8% |
| Taiwanese | 0.3 /100 | #280 | Tragic 33.8% |
| Cypriots | 0.3 /100 | #281 | Tragic 33.8% |
| Immigrants | Korea | 0.3 /100 | #282 | Tragic 33.8% |
| Immigrants | Venezuela | 0.2 /100 | #283 | Tragic 33.7% |
| Immigrants | Spain | 0.2 /100 | #284 | Tragic 33.7% |
Demographics Similar to Immigrants from India by In Labor Force | Age 16-19
In terms of in labor force | age 16-19, the demographic groups most similar to Immigrants from India are Immigrants from Australia (35.1%, a difference of 0.030%), Immigrants from Vietnam (35.0%, a difference of 0.050%), Inupiat (35.0%, a difference of 0.14%), Immigrants from Philippines (35.1%, a difference of 0.17%), and Immigrants from Central America (35.0%, a difference of 0.23%).
| Demographics | Rating | Rank | In Labor Force | Age 16-19 |
| Immigrants | Honduras | 4.9 /100 | #230 | Tragic 35.2% |
| Immigrants | Syria | 4.5 /100 | #231 | Tragic 35.2% |
| Immigrants | Kazakhstan | 4.5 /100 | #232 | Tragic 35.2% |
| Immigrants | France | 4.3 /100 | #233 | Tragic 35.1% |
| Immigrants | Mexico | 4.2 /100 | #234 | Tragic 35.1% |
| Immigrants | Philippines | 4.0 /100 | #235 | Tragic 35.1% |
| Immigrants | Australia | 3.6 /100 | #236 | Tragic 35.1% |
| Immigrants | India | 3.5 /100 | #237 | Tragic 35.0% |
| Immigrants | Vietnam | 3.4 /100 | #238 | Tragic 35.0% |
| Inupiat | 3.2 /100 | #239 | Tragic 35.0% |
| Immigrants | Central America | 3.0 /100 | #240 | Tragic 35.0% |
| Immigrants | Ireland | 2.9 /100 | #241 | Tragic 35.0% |
| Uruguayans | 2.6 /100 | #242 | Tragic 34.9% |
| Pueblo | 2.6 /100 | #243 | Tragic 34.9% |
| Immigrants | Turkey | 2.6 /100 | #244 | Tragic 34.9% |