Immigrants from Egypt vs Immigrants from India In Labor Force | Age 16-19
COMPARE
Immigrants from Egypt
Immigrants from India
In Labor Force | Age 16-19
In Labor Force | Age 16-19 Comparison
Immigrants from Egypt
Immigrants from India
34.6%
IN LABOR FORCE | AGE 16-19
1.2/ 100
METRIC RATING
257th/ 347
METRIC RANK
35.0%
IN LABOR FORCE | AGE 16-19
3.5/ 100
METRIC RATING
237th/ 347
METRIC RANK
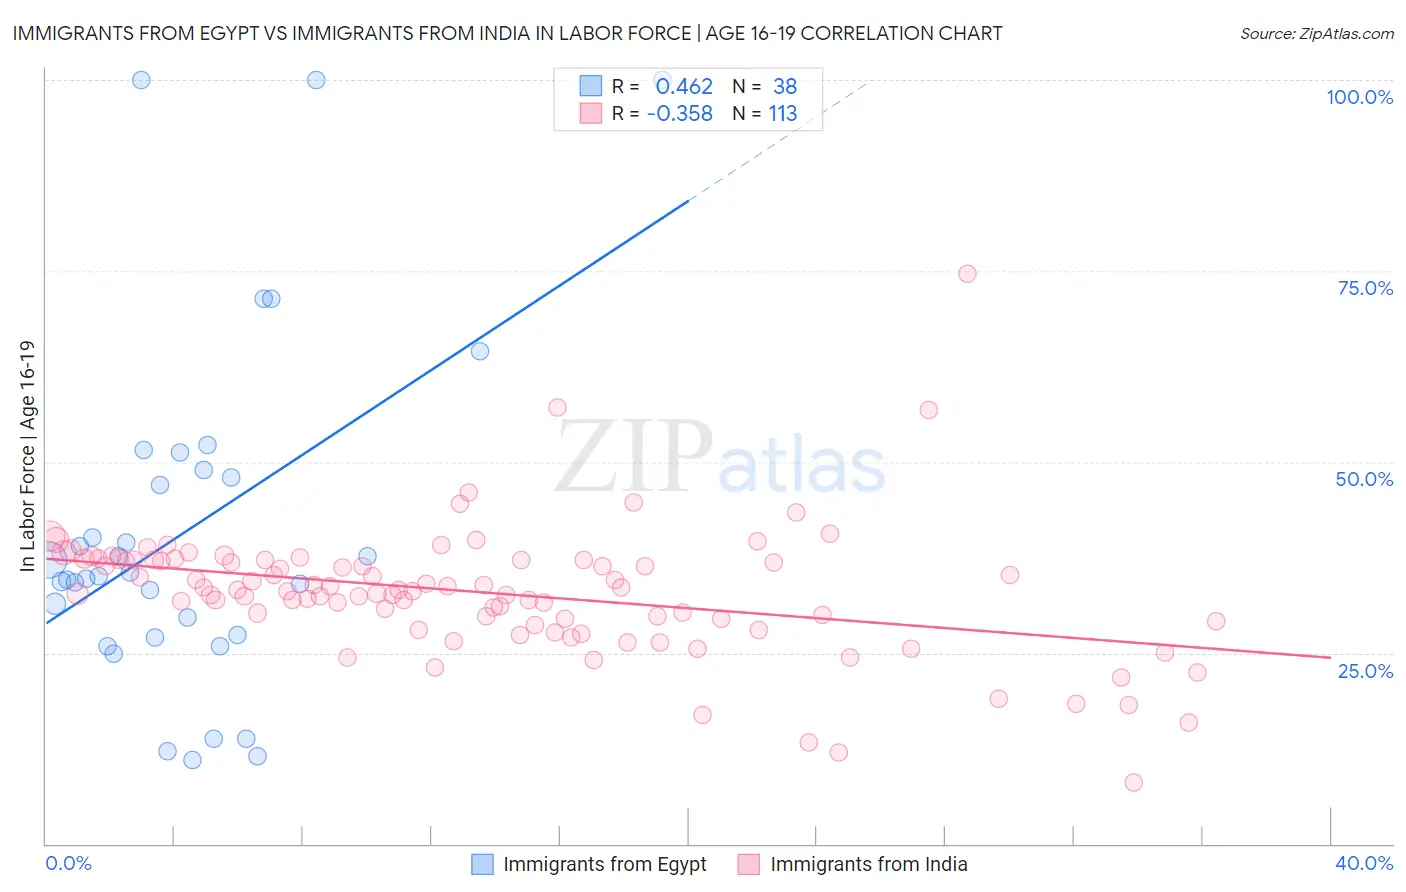
Immigrants from Egypt vs Immigrants from India In Labor Force | Age 16-19 Correlation Chart
The statistical analysis conducted on geographies consisting of 245,278,440 people shows a moderate positive correlation between the proportion of Immigrants from Egypt and labor force participation rate among population between the ages 16 and 19 in the United States with a correlation coefficient (R) of 0.462 and weighted average of 34.6%. Similarly, the statistical analysis conducted on geographies consisting of 433,366,164 people shows a mild negative correlation between the proportion of Immigrants from India and labor force participation rate among population between the ages 16 and 19 in the United States with a correlation coefficient (R) of -0.358 and weighted average of 35.0%, a difference of 1.4%.
In Labor Force | Age 16-19 Correlation Summary
| Measurement | Immigrants from Egypt | Immigrants from India |
| Minimum | 11.0% | 8.1% |
| Maximum | 100.0% | 74.6% |
| Range | 89.0% | 66.5% |
| Mean | 41.2% | 32.9% |
| Median | 35.3% | 33.1% |
| Interquartile 25% (IQ1) | 27.4% | 29.2% |
| Interquartile 75% (IQ3) | 48.9% | 37.2% |
| Interquartile Range (IQR) | 21.5% | 8.0% |
| Standard Deviation (Sample) | 22.7% | 8.5% |
| Standard Deviation (Population) | 22.4% | 8.5% |
Demographics Similar to Immigrants from Egypt and Immigrants from India by In Labor Force | Age 16-19
In terms of in labor force | age 16-19, the demographic groups most similar to Immigrants from Egypt are Immigrants from South Central Asia (34.6%, a difference of 0.010%), Peruvian (34.6%, a difference of 0.11%), Bahamian (34.6%, a difference of 0.15%), Immigrants from Japan (34.7%, a difference of 0.27%), and Immigrants from Chile (34.8%, a difference of 0.64%). Similarly, the demographic groups most similar to Immigrants from India are Immigrants from Vietnam (35.0%, a difference of 0.050%), Inupiat (35.0%, a difference of 0.14%), Immigrants from Central America (35.0%, a difference of 0.23%), Immigrants from Ireland (35.0%, a difference of 0.26%), and Uruguayan (34.9%, a difference of 0.39%).
| Demographics | Rating | Rank | In Labor Force | Age 16-19 |
| Immigrants | India | 3.5 /100 | #237 | Tragic 35.0% |
| Immigrants | Vietnam | 3.4 /100 | #238 | Tragic 35.0% |
| Inupiat | 3.2 /100 | #239 | Tragic 35.0% |
| Immigrants | Central America | 3.0 /100 | #240 | Tragic 35.0% |
| Immigrants | Ireland | 2.9 /100 | #241 | Tragic 35.0% |
| Uruguayans | 2.6 /100 | #242 | Tragic 34.9% |
| Pueblo | 2.6 /100 | #243 | Tragic 34.9% |
| Immigrants | Turkey | 2.6 /100 | #244 | Tragic 34.9% |
| Immigrants | Greece | 2.4 /100 | #245 | Tragic 34.9% |
| Immigrants | Sri Lanka | 2.4 /100 | #246 | Tragic 34.9% |
| Laotians | 2.4 /100 | #247 | Tragic 34.9% |
| Central Americans | 2.2 /100 | #248 | Tragic 34.8% |
| Immigrants | Ukraine | 2.2 /100 | #249 | Tragic 34.8% |
| Immigrants | Pakistan | 2.0 /100 | #250 | Tragic 34.8% |
| Immigrants | Western Asia | 2.0 /100 | #251 | Tragic 34.8% |
| Immigrants | Chile | 2.0 /100 | #252 | Tragic 34.8% |
| Immigrants | Japan | 1.5 /100 | #253 | Tragic 34.7% |
| Bahamians | 1.4 /100 | #254 | Tragic 34.6% |
| Peruvians | 1.4 /100 | #255 | Tragic 34.6% |
| Immigrants | South Central Asia | 1.3 /100 | #256 | Tragic 34.6% |
| Immigrants | Egypt | 1.2 /100 | #257 | Tragic 34.6% |