Carpatho Rusyn vs Immigrants from India In Labor Force | Age 16-19
COMPARE
Carpatho Rusyn
Immigrants from India
In Labor Force | Age 16-19
In Labor Force | Age 16-19 Comparison
Carpatho Rusyns
Immigrants from India
40.8%
IN LABOR FORCE | AGE 16-19
100.0/ 100
METRIC RATING
47th/ 347
METRIC RANK
35.0%
IN LABOR FORCE | AGE 16-19
3.5/ 100
METRIC RATING
237th/ 347
METRIC RANK
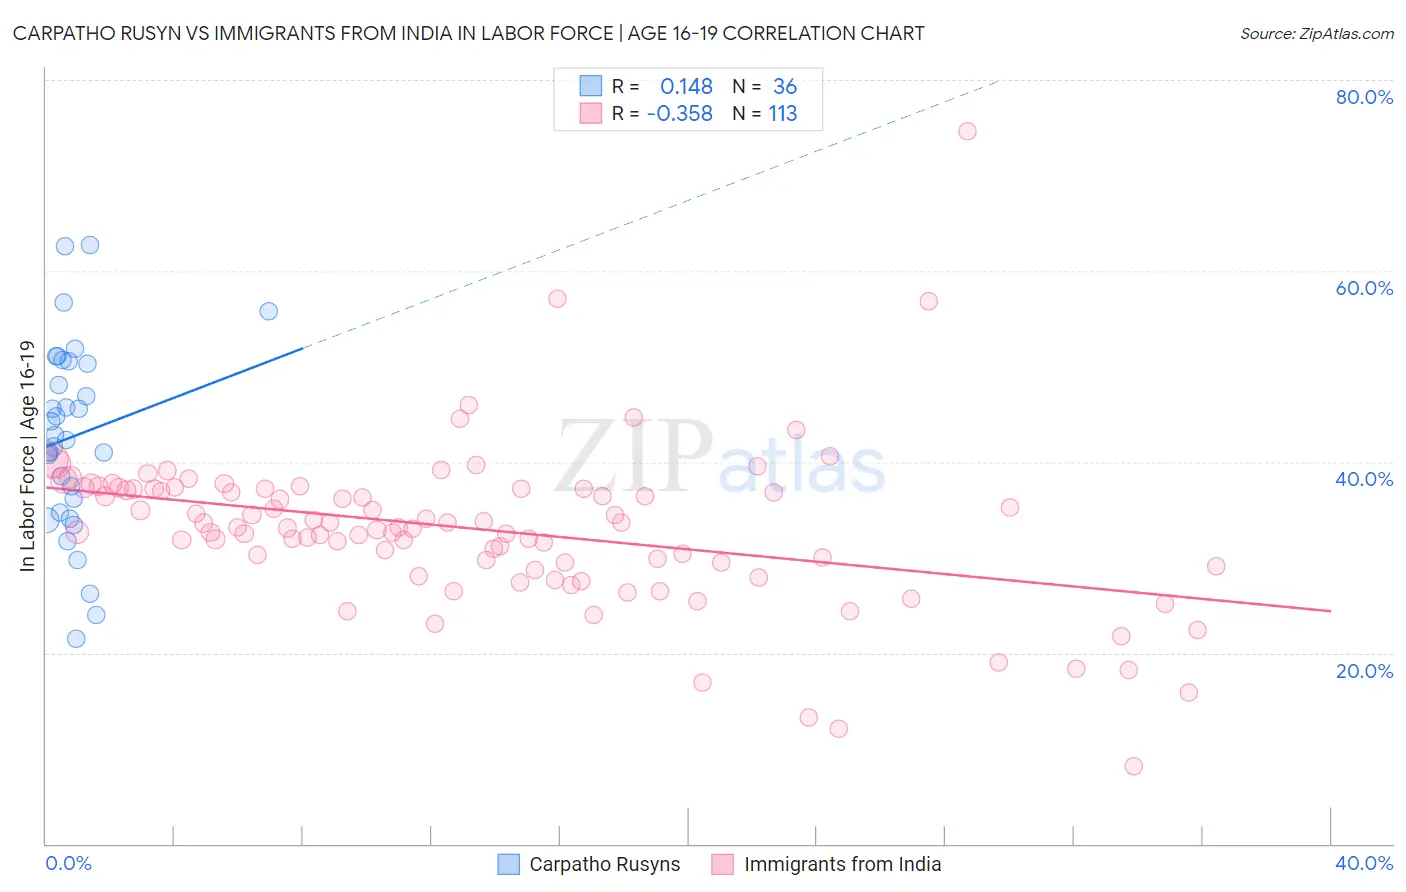
Carpatho Rusyn vs Immigrants from India In Labor Force | Age 16-19 Correlation Chart
The statistical analysis conducted on geographies consisting of 58,860,785 people shows a poor positive correlation between the proportion of Carpatho Rusyns and labor force participation rate among population between the ages 16 and 19 in the United States with a correlation coefficient (R) of 0.148 and weighted average of 40.8%. Similarly, the statistical analysis conducted on geographies consisting of 433,366,164 people shows a mild negative correlation between the proportion of Immigrants from India and labor force participation rate among population between the ages 16 and 19 in the United States with a correlation coefficient (R) of -0.358 and weighted average of 35.0%, a difference of 16.4%.
In Labor Force | Age 16-19 Correlation Summary
| Measurement | Carpatho Rusyn | Immigrants from India |
| Minimum | 21.5% | 8.1% |
| Maximum | 62.8% | 74.6% |
| Range | 41.3% | 66.5% |
| Mean | 42.7% | 32.9% |
| Median | 42.6% | 33.1% |
| Interquartile 25% (IQ1) | 35.4% | 29.2% |
| Interquartile 75% (IQ3) | 50.5% | 37.2% |
| Interquartile Range (IQR) | 15.1% | 8.0% |
| Standard Deviation (Sample) | 9.9% | 8.5% |
| Standard Deviation (Population) | 9.8% | 8.5% |
Similar Demographics by In Labor Force | Age 16-19
Demographics Similar to Carpatho Rusyns by In Labor Force | Age 16-19
In terms of in labor force | age 16-19, the demographic groups most similar to Carpatho Rusyns are Icelander (40.8%, a difference of 0.050%), Cree (40.8%, a difference of 0.070%), Indonesian (40.7%, a difference of 0.23%), Immigrants from Zaire (40.7%, a difference of 0.33%), and Immigrants from Laos (40.6%, a difference of 0.42%).
| Demographics | Rating | Rank | In Labor Force | Age 16-19 |
| Immigrants | Liberia | 100.0 /100 | #40 | Exceptional 41.5% |
| Celtics | 100.0 /100 | #41 | Exceptional 41.3% |
| Whites/Caucasians | 100.0 /100 | #42 | Exceptional 41.3% |
| Tongans | 100.0 /100 | #43 | Exceptional 41.2% |
| Europeans | 100.0 /100 | #44 | Exceptional 41.1% |
| Croatians | 100.0 /100 | #45 | Exceptional 41.1% |
| Immigrants | Sudan | 100.0 /100 | #46 | Exceptional 41.0% |
| Carpatho Rusyns | 100.0 /100 | #47 | Exceptional 40.8% |
| Icelanders | 100.0 /100 | #48 | Exceptional 40.8% |
| Cree | 100.0 /100 | #49 | Exceptional 40.8% |
| Indonesians | 100.0 /100 | #50 | Exceptional 40.7% |
| Immigrants | Zaire | 100.0 /100 | #51 | Exceptional 40.7% |
| Immigrants | Laos | 100.0 /100 | #52 | Exceptional 40.6% |
| Immigrants | Kenya | 100.0 /100 | #53 | Exceptional 40.5% |
| Tlingit-Haida | 100.0 /100 | #54 | Exceptional 40.5% |
Demographics Similar to Immigrants from India by In Labor Force | Age 16-19
In terms of in labor force | age 16-19, the demographic groups most similar to Immigrants from India are Immigrants from Australia (35.1%, a difference of 0.030%), Immigrants from Vietnam (35.0%, a difference of 0.050%), Inupiat (35.0%, a difference of 0.14%), Immigrants from Philippines (35.1%, a difference of 0.17%), and Immigrants from Central America (35.0%, a difference of 0.23%).
| Demographics | Rating | Rank | In Labor Force | Age 16-19 |
| Immigrants | Honduras | 4.9 /100 | #230 | Tragic 35.2% |
| Immigrants | Syria | 4.5 /100 | #231 | Tragic 35.2% |
| Immigrants | Kazakhstan | 4.5 /100 | #232 | Tragic 35.2% |
| Immigrants | France | 4.3 /100 | #233 | Tragic 35.1% |
| Immigrants | Mexico | 4.2 /100 | #234 | Tragic 35.1% |
| Immigrants | Philippines | 4.0 /100 | #235 | Tragic 35.1% |
| Immigrants | Australia | 3.6 /100 | #236 | Tragic 35.1% |
| Immigrants | India | 3.5 /100 | #237 | Tragic 35.0% |
| Immigrants | Vietnam | 3.4 /100 | #238 | Tragic 35.0% |
| Inupiat | 3.2 /100 | #239 | Tragic 35.0% |
| Immigrants | Central America | 3.0 /100 | #240 | Tragic 35.0% |
| Immigrants | Ireland | 2.9 /100 | #241 | Tragic 35.0% |
| Uruguayans | 2.6 /100 | #242 | Tragic 34.9% |
| Pueblo | 2.6 /100 | #243 | Tragic 34.9% |
| Immigrants | Turkey | 2.6 /100 | #244 | Tragic 34.9% |