Arapaho vs Danish In Labor Force | Age > 16
COMPARE
Arapaho
Danish
In Labor Force | Age > 16
In Labor Force | Age > 16 Comparison
Arapaho
Danes
62.1%
IN LABOR FORCE | AGE > 16
0.0/ 100
METRIC RATING
319th/ 347
METRIC RANK
65.3%
IN LABOR FORCE | AGE > 16
68.8/ 100
METRIC RATING
164th/ 347
METRIC RANK
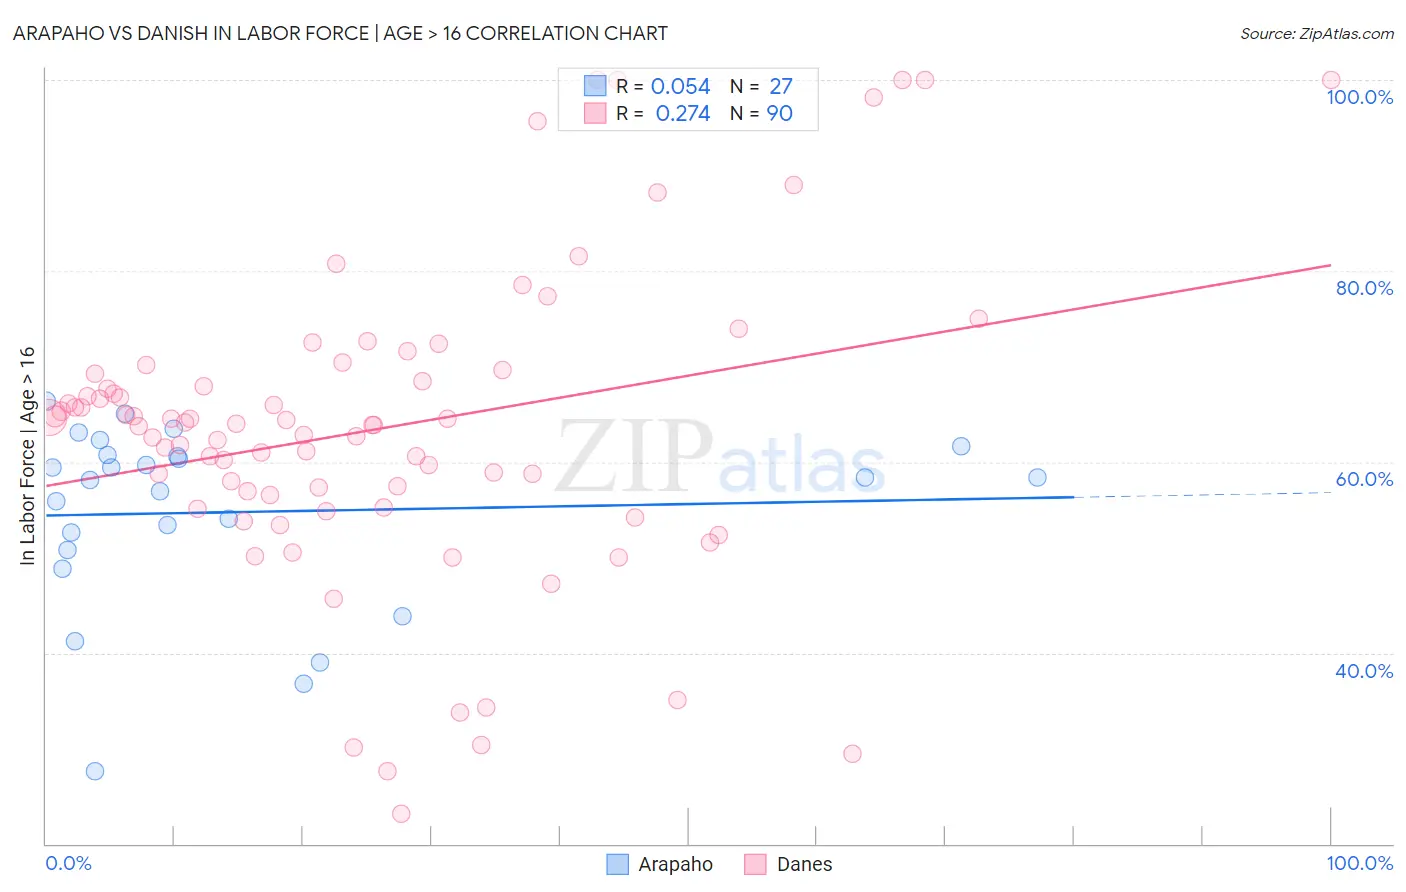
Arapaho vs Danish In Labor Force | Age > 16 Correlation Chart
The statistical analysis conducted on geographies consisting of 29,780,325 people shows a slight positive correlation between the proportion of Arapaho and labor force participation rate among population ages 16 and over in the United States with a correlation coefficient (R) of 0.054 and weighted average of 62.1%. Similarly, the statistical analysis conducted on geographies consisting of 474,191,872 people shows a weak positive correlation between the proportion of Danes and labor force participation rate among population ages 16 and over in the United States with a correlation coefficient (R) of 0.274 and weighted average of 65.3%, a difference of 5.0%.
In Labor Force | Age > 16 Correlation Summary
| Measurement | Arapaho | Danish |
| Minimum | 27.6% | 23.1% |
| Maximum | 66.4% | 100.0% |
| Range | 38.8% | 76.9% |
| Mean | 54.7% | 63.4% |
| Median | 58.4% | 63.9% |
| Interquartile 25% (IQ1) | 50.7% | 56.6% |
| Interquartile 75% (IQ3) | 60.7% | 69.2% |
| Interquartile Range (IQR) | 10.0% | 12.7% |
| Standard Deviation (Sample) | 9.6% | 16.2% |
| Standard Deviation (Population) | 9.4% | 16.1% |
Similar Demographics by In Labor Force | Age > 16
Demographics Similar to Arapaho by In Labor Force | Age > 16
In terms of in labor force | age > 16, the demographic groups most similar to Arapaho are Yakama (62.1%, a difference of 0.0%), American (62.1%, a difference of 0.040%), Ottawa (62.0%, a difference of 0.20%), Seminole (62.0%, a difference of 0.22%), and Chickasaw (62.3%, a difference of 0.24%).
| Demographics | Rating | Rank | In Labor Force | Age > 16 |
| Iroquois | 0.0 /100 | #312 | Tragic 63.2% |
| Chippewa | 0.0 /100 | #313 | Tragic 63.1% |
| Yaqui | 0.0 /100 | #314 | Tragic 63.0% |
| Potawatomi | 0.0 /100 | #315 | Tragic 62.8% |
| Yup'ik | 0.0 /100 | #316 | Tragic 62.7% |
| Kiowa | 0.0 /100 | #317 | Tragic 62.4% |
| Chickasaw | 0.0 /100 | #318 | Tragic 62.3% |
| Arapaho | 0.0 /100 | #319 | Tragic 62.1% |
| Yakama | 0.0 /100 | #320 | Tragic 62.1% |
| Americans | 0.0 /100 | #321 | Tragic 62.1% |
| Ottawa | 0.0 /100 | #322 | Tragic 62.0% |
| Seminole | 0.0 /100 | #323 | Tragic 62.0% |
| Cheyenne | 0.0 /100 | #324 | Tragic 62.0% |
| Cherokee | 0.0 /100 | #325 | Tragic 61.9% |
| Sioux | 0.0 /100 | #326 | Tragic 61.8% |
Demographics Similar to Danes by In Labor Force | Age > 16
In terms of in labor force | age > 16, the demographic groups most similar to Danes are South African (65.3%, a difference of 0.010%), Immigrants from Kazakhstan (65.3%, a difference of 0.010%), Immigrants from Western Asia (65.3%, a difference of 0.020%), Australian (65.3%, a difference of 0.030%), and Albanian (65.3%, a difference of 0.030%).
| Demographics | Rating | Rank | In Labor Force | Age > 16 |
| Immigrants | Russia | 75.7 /100 | #157 | Good 65.3% |
| Panamanians | 75.2 /100 | #158 | Good 65.3% |
| Immigrants | Syria | 74.6 /100 | #159 | Good 65.3% |
| Immigrants | South Africa | 73.5 /100 | #160 | Good 65.3% |
| Australians | 71.3 /100 | #161 | Good 65.3% |
| Albanians | 70.8 /100 | #162 | Good 65.3% |
| South Africans | 69.8 /100 | #163 | Good 65.3% |
| Danes | 68.8 /100 | #164 | Good 65.3% |
| Immigrants | Kazakhstan | 68.1 /100 | #165 | Good 65.3% |
| Immigrants | Western Asia | 67.3 /100 | #166 | Good 65.3% |
| Immigrants | Belarus | 66.0 /100 | #167 | Good 65.2% |
| Serbians | 63.5 /100 | #168 | Good 65.2% |
| Arabs | 62.4 /100 | #169 | Good 65.2% |
| Immigrants | Israel | 61.7 /100 | #170 | Good 65.2% |
| Israelis | 61.6 /100 | #171 | Good 65.2% |