Immigrants from England vs Danish In Labor Force | Age > 16
COMPARE
Immigrants from England
Danish
In Labor Force | Age > 16
In Labor Force | Age > 16 Comparison
Immigrants from England
Danes
64.2%
IN LABOR FORCE | AGE > 16
0.5/ 100
METRIC RATING
266th/ 347
METRIC RANK
65.3%
IN LABOR FORCE | AGE > 16
68.8/ 100
METRIC RATING
164th/ 347
METRIC RANK
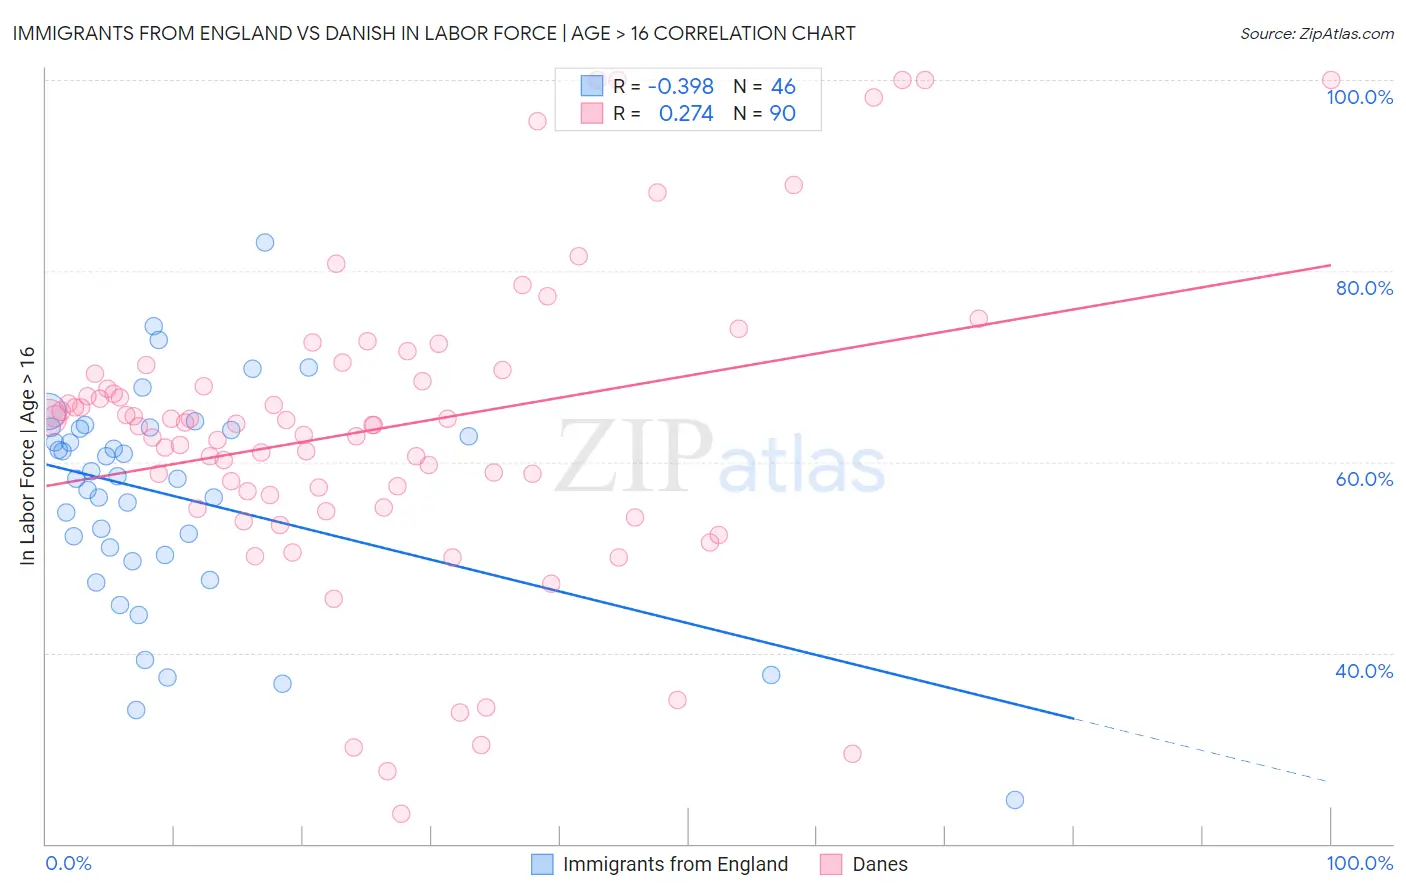
Immigrants from England vs Danish In Labor Force | Age > 16 Correlation Chart
The statistical analysis conducted on geographies consisting of 391,897,781 people shows a mild negative correlation between the proportion of Immigrants from England and labor force participation rate among population ages 16 and over in the United States with a correlation coefficient (R) of -0.398 and weighted average of 64.2%. Similarly, the statistical analysis conducted on geographies consisting of 474,191,872 people shows a weak positive correlation between the proportion of Danes and labor force participation rate among population ages 16 and over in the United States with a correlation coefficient (R) of 0.274 and weighted average of 65.3%, a difference of 1.7%.
In Labor Force | Age > 16 Correlation Summary
| Measurement | Immigrants from England | Danish |
| Minimum | 24.6% | 23.1% |
| Maximum | 83.0% | 100.0% |
| Range | 58.4% | 76.9% |
| Mean | 56.4% | 63.4% |
| Median | 58.3% | 63.9% |
| Interquartile 25% (IQ1) | 50.2% | 56.6% |
| Interquartile 75% (IQ3) | 63.5% | 69.2% |
| Interquartile Range (IQR) | 13.3% | 12.7% |
| Standard Deviation (Sample) | 11.5% | 16.2% |
| Standard Deviation (Population) | 11.3% | 16.1% |
Similar Demographics by In Labor Force | Age > 16
Demographics Similar to Immigrants from England by In Labor Force | Age > 16
In terms of in labor force | age > 16, the demographic groups most similar to Immigrants from England are Cuban (64.2%, a difference of 0.010%), Canadian (64.1%, a difference of 0.010%), Spaniard (64.1%, a difference of 0.010%), Dutch (64.2%, a difference of 0.050%), and Irish (64.1%, a difference of 0.050%).
| Demographics | Rating | Rank | In Labor Force | Age > 16 |
| Immigrants | Western Europe | 0.7 /100 | #259 | Tragic 64.2% |
| Marshallese | 0.7 /100 | #260 | Tragic 64.2% |
| Basques | 0.7 /100 | #261 | Tragic 64.2% |
| Finns | 0.7 /100 | #262 | Tragic 64.2% |
| Bahamians | 0.6 /100 | #263 | Tragic 64.2% |
| Dutch | 0.6 /100 | #264 | Tragic 64.2% |
| Cubans | 0.5 /100 | #265 | Tragic 64.2% |
| Immigrants | England | 0.5 /100 | #266 | Tragic 64.2% |
| Canadians | 0.5 /100 | #267 | Tragic 64.1% |
| Spaniards | 0.5 /100 | #268 | Tragic 64.1% |
| Irish | 0.4 /100 | #269 | Tragic 64.1% |
| Guyanese | 0.4 /100 | #270 | Tragic 64.1% |
| Dominicans | 0.4 /100 | #271 | Tragic 64.1% |
| Native Hawaiians | 0.3 /100 | #272 | Tragic 64.1% |
| Hmong | 0.3 /100 | #273 | Tragic 64.1% |
Demographics Similar to Danes by In Labor Force | Age > 16
In terms of in labor force | age > 16, the demographic groups most similar to Danes are South African (65.3%, a difference of 0.010%), Immigrants from Kazakhstan (65.3%, a difference of 0.010%), Immigrants from Western Asia (65.3%, a difference of 0.020%), Australian (65.3%, a difference of 0.030%), and Albanian (65.3%, a difference of 0.030%).
| Demographics | Rating | Rank | In Labor Force | Age > 16 |
| Immigrants | Russia | 75.7 /100 | #157 | Good 65.3% |
| Panamanians | 75.2 /100 | #158 | Good 65.3% |
| Immigrants | Syria | 74.6 /100 | #159 | Good 65.3% |
| Immigrants | South Africa | 73.5 /100 | #160 | Good 65.3% |
| Australians | 71.3 /100 | #161 | Good 65.3% |
| Albanians | 70.8 /100 | #162 | Good 65.3% |
| South Africans | 69.8 /100 | #163 | Good 65.3% |
| Danes | 68.8 /100 | #164 | Good 65.3% |
| Immigrants | Kazakhstan | 68.1 /100 | #165 | Good 65.3% |
| Immigrants | Western Asia | 67.3 /100 | #166 | Good 65.3% |
| Immigrants | Belarus | 66.0 /100 | #167 | Good 65.2% |
| Serbians | 63.5 /100 | #168 | Good 65.2% |
| Arabs | 62.4 /100 | #169 | Good 65.2% |
| Immigrants | Israel | 61.7 /100 | #170 | Good 65.2% |
| Israelis | 61.6 /100 | #171 | Good 65.2% |