Arapaho vs Nonimmigrants In Labor Force | Age > 16
COMPARE
Arapaho
Nonimmigrants
In Labor Force | Age > 16
In Labor Force | Age > 16 Comparison
Arapaho
Nonimmigrants
62.1%
IN LABOR FORCE | AGE > 16
0.0/ 100
METRIC RATING
319th/ 347
METRIC RANK
63.5%
IN LABOR FORCE | AGE > 16
0.0/ 100
METRIC RATING
304th/ 347
METRIC RANK
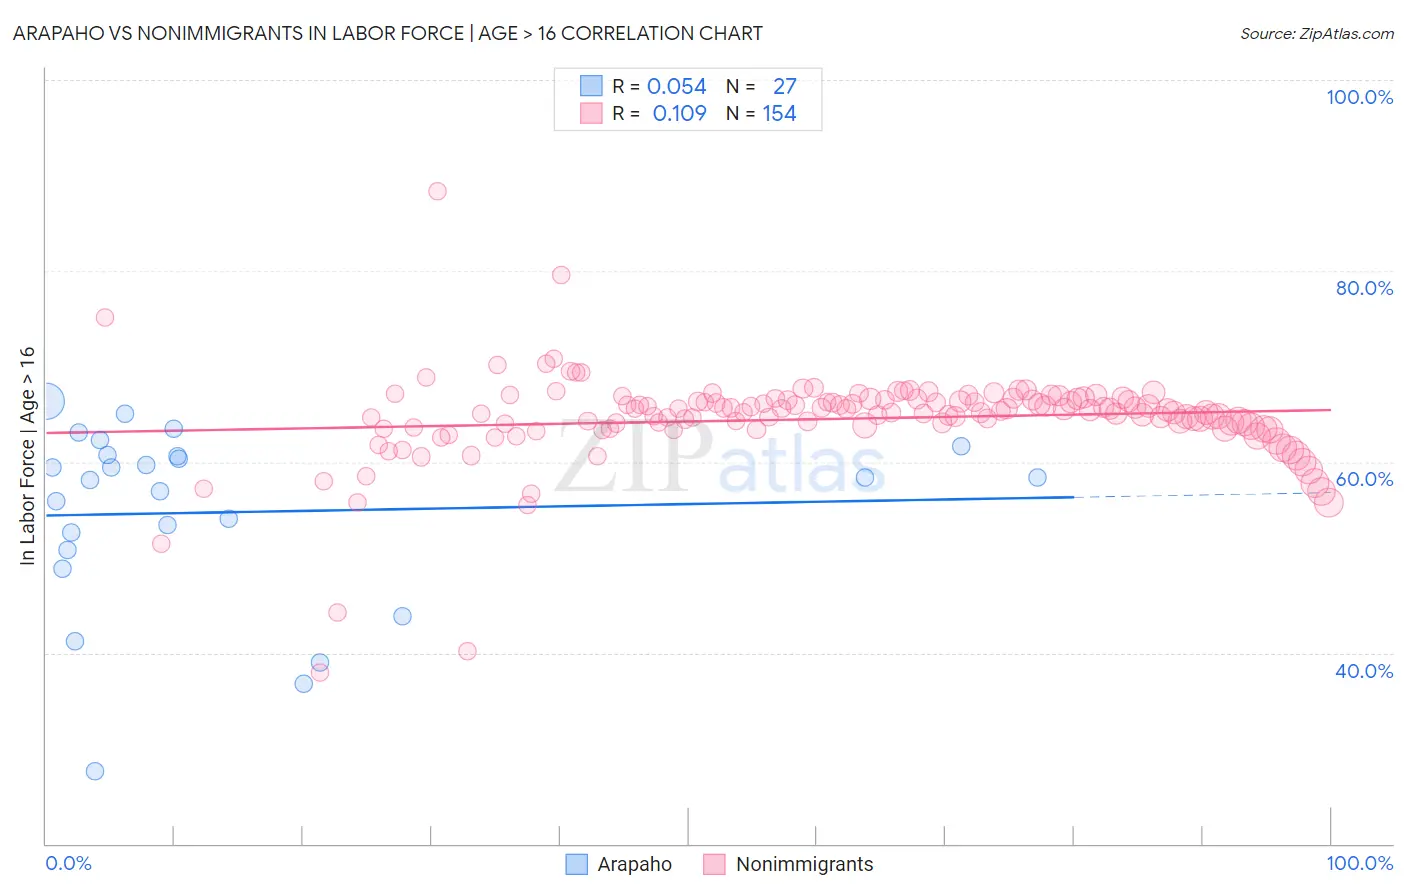
Arapaho vs Nonimmigrants In Labor Force | Age > 16 Correlation Chart
The statistical analysis conducted on geographies consisting of 29,780,325 people shows a slight positive correlation between the proportion of Arapaho and labor force participation rate among population ages 16 and over in the United States with a correlation coefficient (R) of 0.054 and weighted average of 62.1%. Similarly, the statistical analysis conducted on geographies consisting of 585,341,591 people shows a poor positive correlation between the proportion of Nonimmigrants and labor force participation rate among population ages 16 and over in the United States with a correlation coefficient (R) of 0.109 and weighted average of 63.5%, a difference of 2.2%.
In Labor Force | Age > 16 Correlation Summary
| Measurement | Arapaho | Nonimmigrants |
| Minimum | 27.6% | 37.9% |
| Maximum | 66.4% | 88.4% |
| Range | 38.8% | 50.5% |
| Mean | 54.7% | 64.5% |
| Median | 58.4% | 65.2% |
| Interquartile 25% (IQ1) | 50.7% | 63.5% |
| Interquartile 75% (IQ3) | 60.7% | 66.5% |
| Interquartile Range (IQR) | 10.0% | 3.0% |
| Standard Deviation (Sample) | 9.6% | 5.1% |
| Standard Deviation (Population) | 9.4% | 5.1% |
Demographics Similar to Arapaho and Nonimmigrants by In Labor Force | Age > 16
In terms of in labor force | age > 16, the demographic groups most similar to Arapaho are Yakama (62.1%, a difference of 0.0%), American (62.1%, a difference of 0.040%), Chickasaw (62.3%, a difference of 0.24%), Kiowa (62.4%, a difference of 0.44%), and Yup'ik (62.7%, a difference of 0.88%). Similarly, the demographic groups most similar to Nonimmigrants are Cree (63.5%, a difference of 0.050%), Osage (63.5%, a difference of 0.050%), Delaware (63.6%, a difference of 0.090%), Spanish American (63.6%, a difference of 0.11%), and Black/African American (63.4%, a difference of 0.14%).
| Demographics | Rating | Rank | In Labor Force | Age > 16 |
| Spanish Americans | 0.0 /100 | #301 | Tragic 63.6% |
| Delaware | 0.0 /100 | #302 | Tragic 63.6% |
| Cree | 0.0 /100 | #303 | Tragic 63.5% |
| Immigrants | Nonimmigrants | 0.0 /100 | #304 | Tragic 63.5% |
| Osage | 0.0 /100 | #305 | Tragic 63.5% |
| Blacks/African Americans | 0.0 /100 | #306 | Tragic 63.4% |
| Central American Indians | 0.0 /100 | #307 | Tragic 63.4% |
| Pennsylvania Germans | 0.0 /100 | #308 | Tragic 63.4% |
| Scotch-Irish | 0.0 /100 | #309 | Tragic 63.3% |
| Shoshone | 0.0 /100 | #310 | Tragic 63.2% |
| Blackfeet | 0.0 /100 | #311 | Tragic 63.2% |
| Iroquois | 0.0 /100 | #312 | Tragic 63.2% |
| Chippewa | 0.0 /100 | #313 | Tragic 63.1% |
| Yaqui | 0.0 /100 | #314 | Tragic 63.0% |
| Potawatomi | 0.0 /100 | #315 | Tragic 62.8% |
| Yup'ik | 0.0 /100 | #316 | Tragic 62.7% |
| Kiowa | 0.0 /100 | #317 | Tragic 62.4% |
| Chickasaw | 0.0 /100 | #318 | Tragic 62.3% |
| Arapaho | 0.0 /100 | #319 | Tragic 62.1% |
| Yakama | 0.0 /100 | #320 | Tragic 62.1% |
| Americans | 0.0 /100 | #321 | Tragic 62.1% |