Haitian vs Danish In Labor Force | Age > 16
COMPARE
Haitian
Danish
In Labor Force | Age > 16
In Labor Force | Age > 16 Comparison
Haitians
Danes
65.0%
IN LABOR FORCE | AGE > 16
30.6/ 100
METRIC RATING
196th/ 347
METRIC RANK
65.3%
IN LABOR FORCE | AGE > 16
68.8/ 100
METRIC RATING
164th/ 347
METRIC RANK
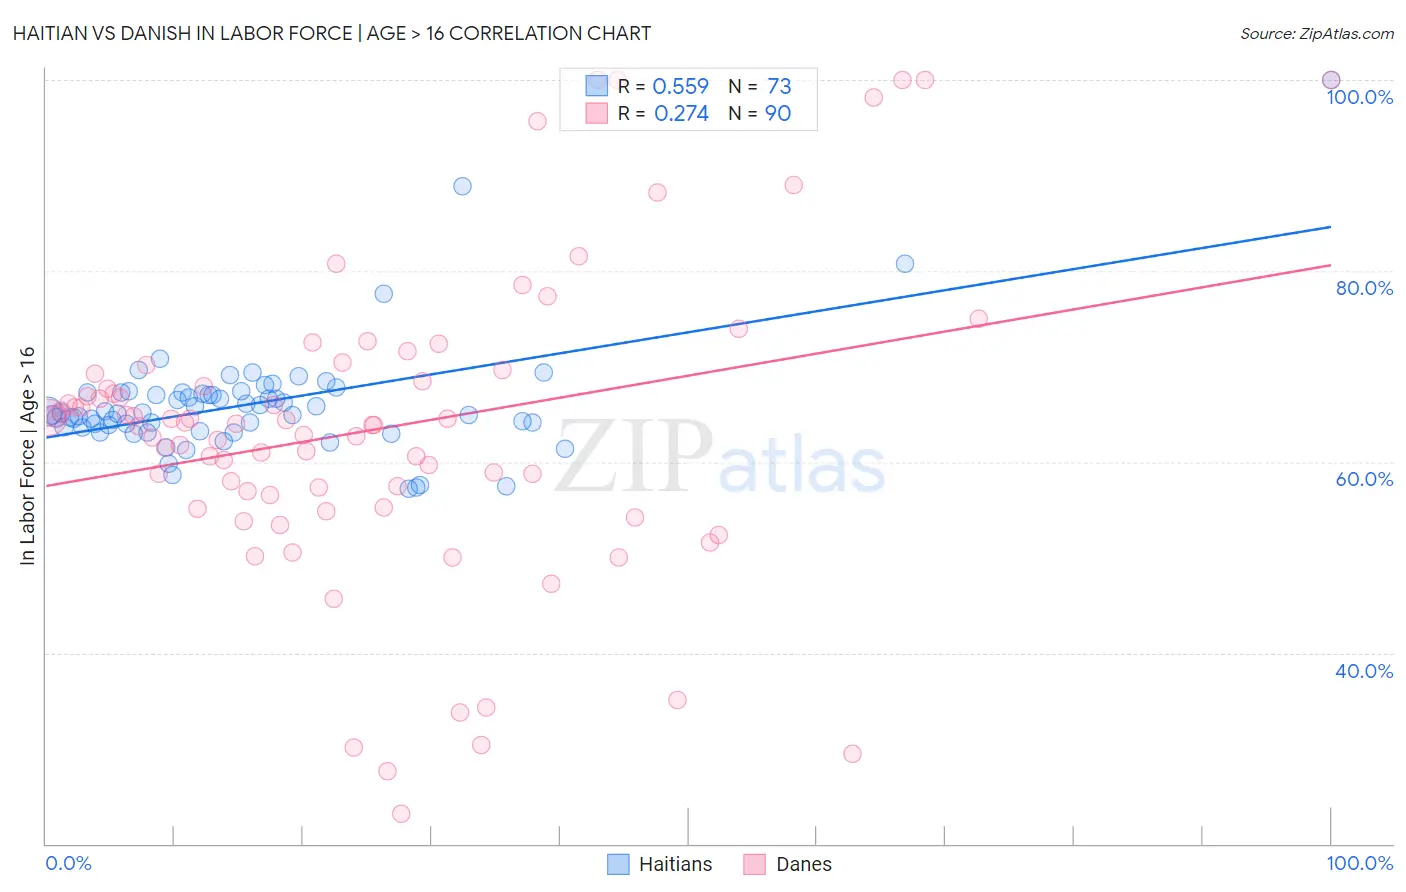
Haitian vs Danish In Labor Force | Age > 16 Correlation Chart
The statistical analysis conducted on geographies consisting of 288,007,130 people shows a substantial positive correlation between the proportion of Haitians and labor force participation rate among population ages 16 and over in the United States with a correlation coefficient (R) of 0.559 and weighted average of 65.0%. Similarly, the statistical analysis conducted on geographies consisting of 474,191,872 people shows a weak positive correlation between the proportion of Danes and labor force participation rate among population ages 16 and over in the United States with a correlation coefficient (R) of 0.274 and weighted average of 65.3%, a difference of 0.45%.
In Labor Force | Age > 16 Correlation Summary
| Measurement | Haitian | Danish |
| Minimum | 57.2% | 23.1% |
| Maximum | 100.0% | 100.0% |
| Range | 42.8% | 76.9% |
| Mean | 66.1% | 63.4% |
| Median | 65.1% | 63.9% |
| Interquartile 25% (IQ1) | 63.6% | 56.6% |
| Interquartile 75% (IQ3) | 67.3% | 69.2% |
| Interquartile Range (IQR) | 3.6% | 12.7% |
| Standard Deviation (Sample) | 6.2% | 16.2% |
| Standard Deviation (Population) | 6.1% | 16.1% |
Similar Demographics by In Labor Force | Age > 16
Demographics Similar to Haitians by In Labor Force | Age > 16
In terms of in labor force | age > 16, the demographic groups most similar to Haitians are Immigrants from Southern Europe (65.0%, a difference of 0.010%), Romanian (65.0%, a difference of 0.010%), Immigrants from Italy (65.0%, a difference of 0.030%), Barbadian (65.0%, a difference of 0.040%), and Scandinavian (65.0%, a difference of 0.040%).
| Demographics | Rating | Rank | In Labor Force | Age > 16 |
| Immigrants | Greece | 34.3 /100 | #189 | Fair 65.0% |
| Barbadians | 33.9 /100 | #190 | Fair 65.0% |
| Scandinavians | 33.7 /100 | #191 | Fair 65.0% |
| Immigrants | Fiji | 33.7 /100 | #192 | Fair 65.0% |
| Immigrants | Europe | 33.6 /100 | #193 | Fair 65.0% |
| Immigrants | Southern Europe | 31.3 /100 | #194 | Fair 65.0% |
| Romanians | 31.1 /100 | #195 | Fair 65.0% |
| Haitians | 30.6 /100 | #196 | Fair 65.0% |
| Immigrants | Italy | 28.7 /100 | #197 | Fair 65.0% |
| Greeks | 26.1 /100 | #198 | Fair 64.9% |
| Mexican American Indians | 23.1 /100 | #199 | Fair 64.9% |
| Armenians | 20.2 /100 | #200 | Fair 64.9% |
| Ukrainians | 19.6 /100 | #201 | Poor 64.9% |
| Immigrants | Belgium | 19.4 /100 | #202 | Poor 64.9% |
| Russians | 18.8 /100 | #203 | Poor 64.9% |
Demographics Similar to Danes by In Labor Force | Age > 16
In terms of in labor force | age > 16, the demographic groups most similar to Danes are South African (65.3%, a difference of 0.010%), Immigrants from Kazakhstan (65.3%, a difference of 0.010%), Immigrants from Western Asia (65.3%, a difference of 0.020%), Australian (65.3%, a difference of 0.030%), and Albanian (65.3%, a difference of 0.030%).
| Demographics | Rating | Rank | In Labor Force | Age > 16 |
| Immigrants | Russia | 75.7 /100 | #157 | Good 65.3% |
| Panamanians | 75.2 /100 | #158 | Good 65.3% |
| Immigrants | Syria | 74.6 /100 | #159 | Good 65.3% |
| Immigrants | South Africa | 73.5 /100 | #160 | Good 65.3% |
| Australians | 71.3 /100 | #161 | Good 65.3% |
| Albanians | 70.8 /100 | #162 | Good 65.3% |
| South Africans | 69.8 /100 | #163 | Good 65.3% |
| Danes | 68.8 /100 | #164 | Good 65.3% |
| Immigrants | Kazakhstan | 68.1 /100 | #165 | Good 65.3% |
| Immigrants | Western Asia | 67.3 /100 | #166 | Good 65.3% |
| Immigrants | Belarus | 66.0 /100 | #167 | Good 65.2% |
| Serbians | 63.5 /100 | #168 | Good 65.2% |
| Arabs | 62.4 /100 | #169 | Good 65.2% |
| Immigrants | Israel | 61.7 /100 | #170 | Good 65.2% |
| Israelis | 61.6 /100 | #171 | Good 65.2% |