Arapaho vs Danish 8th Grade

COMPARE

Arapaho
Race
Ancestry
AfghanAfricanAlaska NativeAlaskan AthabascanAlbanianAleutAlsatianAmericanApacheArabArapahoArgentineanArmenianAssyrian/Chaldean/SyriacAustralianAustrianBahamianBangladeshiBarbadianBasqueBelgianBelizeanBermudanBhutaneseBlackfeetBolivianBrazilianBritishBritish West IndianBulgarianBurmeseCajunCambodianCanadianCape VerdeanCarpatho RusynCelticCentral AmericanCentral American IndianCherokeeCheyenneChickasawChileanChineseChippewaChoctawColombianColvilleComancheCosta RicanCreeCreekCroatianCrowCubanCypriotCzechCzechoslovakianDelawareDominicanDutchDutch West IndianEastern EuropeanEcuadorianEgyptianEnglishEstonianEthiopianEuropeanFijianFilipinoFinnishFrenchFrench American IndianFrench CanadianGermanGerman RussianGhanaianGreekGuamanian/ChamorroGuatemalanGuyaneseHaitianHmongHonduranHopiHoumaHungarianIcelanderIndian (Asian)IndonesianInupiatIranianIraqiIrishIroquoisIsraeliItalianJamaicanJapaneseJordanianKenyanKiowaKoreanLaotianLatvianLebaneseLiberianLithuanianLumbeeLuxembourgerMacedonianMalaysianMalteseMarshalleseMenomineeMexicanMexican American IndianMongolianMoroccanNative HawaiianNavajoNepaleseNew ZealanderNicaraguanNigerianNorthern EuropeanNorwegianOkinawanOsageOttawaPaiutePakistaniPalestinianPanamanianParaguayanPennsylvania GermanPeruvianPimaPolishPortuguesePotawatomiPuebloPuerto RicanPuget Sound SalishRomanianRussianSalvadoranSamoanScandinavianScotch-IrishScottishSeminoleSenegaleseSerbianShoshoneSierra LeoneanSiouxSlavicSlovakSloveneSomaliSouth AfricanSouth AmericanSouth American IndianSoviet UnionSpaniardSpanishSpanish AmericanSpanish American IndianSri LankanSubsaharan AfricanSudaneseSwedishSwissSyrianTaiwaneseThaiTlingit-HaidaTohono O'OdhamTonganTrinidadian and TobagonianTsimshianTurkishU.S. Virgin IslanderUgandanUkrainianUruguayanUteVenezuelanVietnameseWelshWest IndianYakamaYaquiYugoslavianYumanYup'ikZimbabwean
Immigration
NonimmigrantsImmigrantsAfghanistanAfricaAlbaniaArgentinaArmeniaAsiaAustraliaAustriaBahamasBangladeshBarbadosBelarusBelgiumBelizeBoliviaBosnia and HerzegovinaBrazilBulgariaBurma/MyanmarCabo VerdeCambodiaCameroonCanadaCaribbeanCentral AmericaChileChinaColombiaCongoCosta RicaCroatiaCubaCzechoslovakiaDenmarkDominicaDominican RepublicEastern AfricaEastern AsiaEastern EuropeEcuadorEgyptEl SalvadorEnglandEritreaEthiopiaEuropeFijiFranceGermanyGhanaGreeceGrenadaGuatemalaGuyanaHaitiHondurasHong KongHungaryIndiaIndonesiaIranIraqIrelandIsraelItalyJamaicaJapanJordanKazakhstanKenyaKoreaKuwaitLaosLatin AmericaLatviaLebanonLiberiaLithuaniaMalaysiaMexicoMicronesiaMiddle AfricaMoldovaMoroccoNepalNetherlandsNicaraguaNigeriaNorth AmericaNorth MacedoniaNorthern AfricaNorthern EuropeNorwayOceaniaPakistanPanamaPeruPhilippinesPolandPortugalRomaniaRussiaSaudi ArabiaScotlandSenegalSerbiaSierra LeoneSingaporeSomaliaSouth AfricaSouth AmericaSouth Central AsiaSouth Eastern AsiaSouthern EuropeSpainSri LankaSt. Vincent and the GrenadinesSudanSwedenSwitzerlandSyriaTaiwanThailandTrinidad and TobagoTurkeyUgandaUkraineUruguayUzbekistanVenezuelaVietnamWest IndiesWestern AfricaWestern AsiaWestern EuropeYemenZaireZimbabweAzores
Danish
Race
Ancestry
AfghanAfricanAlaska NativeAlaskan AthabascanAlbanianAleutAlsatianAmericanApacheArabArgentineanArmenianAssyrian/Chaldean/SyriacAustralianAustrianBahamianBangladeshiBarbadianBasqueBelgianBelizeanBermudanBhutaneseBlackfeetBolivianBrazilianBritishBritish West IndianBulgarianBurmeseCajunCambodianCanadianCape VerdeanCarpatho RusynCelticCentral AmericanCentral American IndianCherokeeCheyenneChickasawChileanChineseChippewaChoctawColombianColvilleComancheCosta RicanCreeCreekCroatianCrowCubanCypriotCzechCzechoslovakianDanishDelawareDominicanDutchDutch West IndianEastern EuropeanEcuadorianEgyptianEnglishEstonianEthiopianEuropeanFijianFilipinoFinnishFrenchFrench American IndianFrench CanadianGermanGerman RussianGhanaianGreekGuamanian/ChamorroGuatemalanGuyaneseHaitianHmongHonduranHopiHoumaHungarianIcelanderIndian (Asian)IndonesianInupiatIranianIraqiIrishIroquoisIsraeliItalianJamaicanJapaneseJordanianKenyanKiowaKoreanLaotianLatvianLebaneseLiberianLithuanianLumbeeLuxembourgerMacedonianMalaysianMalteseMarshalleseMenomineeMexicanMexican American IndianMongolianMoroccanNative HawaiianNavajoNepaleseNew ZealanderNicaraguanNigerianNorthern EuropeanNorwegianOkinawanOsageOttawaPaiutePakistaniPalestinianPanamanianParaguayanPennsylvania GermanPeruvianPimaPolishPortuguesePotawatomiPuebloPuerto RicanPuget Sound SalishRomanianRussianSalvadoranSamoanScandinavianScotch-IrishScottishSeminoleSenegaleseSerbianShoshoneSierra LeoneanSiouxSlavicSlovakSloveneSomaliSouth AfricanSouth AmericanSouth American IndianSoviet UnionSpaniardSpanishSpanish AmericanSpanish American IndianSri LankanSubsaharan AfricanSudaneseSwedishSwissSyrianTaiwaneseThaiTlingit-HaidaTohono O'OdhamTonganTrinidadian and TobagonianTsimshianTurkishU.S. Virgin IslanderUgandanUkrainianUruguayanUteVenezuelanVietnameseWelshWest IndianYakamaYaquiYugoslavianYumanYup'ikZimbabwean
Immigration
NonimmigrantsImmigrantsAfghanistanAfricaAlbaniaArgentinaArmeniaAsiaAustraliaAustriaBahamasBangladeshBarbadosBelarusBelgiumBelizeBoliviaBosnia and HerzegovinaBrazilBulgariaBurma/MyanmarCabo VerdeCambodiaCameroonCanadaCaribbeanCentral AmericaChileChinaColombiaCongoCosta RicaCroatiaCubaCzechoslovakiaDenmarkDominicaDominican RepublicEastern AfricaEastern AsiaEastern EuropeEcuadorEgyptEl SalvadorEnglandEritreaEthiopiaEuropeFijiFranceGermanyGhanaGreeceGrenadaGuatemalaGuyanaHaitiHondurasHong KongHungaryIndiaIndonesiaIranIraqIrelandIsraelItalyJamaicaJapanJordanKazakhstanKenyaKoreaKuwaitLaosLatin AmericaLatviaLebanonLiberiaLithuaniaMalaysiaMexicoMicronesiaMiddle AfricaMoldovaMoroccoNepalNetherlandsNicaraguaNigeriaNorth AmericaNorth MacedoniaNorthern AfricaNorthern EuropeNorwayOceaniaPakistanPanamaPeruPhilippinesPolandPortugalRomaniaRussiaSaudi ArabiaScotlandSenegalSerbiaSierra LeoneSingaporeSomaliaSouth AfricaSouth AmericaSouth Central AsiaSouth Eastern AsiaSouthern EuropeSpainSri LankaSt. Vincent and the GrenadinesSudanSwedenSwitzerlandSyriaTaiwanThailandTrinidad and TobagoTurkeyUgandaUkraineUruguayUzbekistanVenezuelaVietnamWest IndiesWestern AfricaWestern AsiaWestern EuropeYemenZaireZimbabweAzores
8th Grade
Income
Poverty
Unemployment
Labor Participation
Family Structure
Vehicle Availability
Education Level
Disability

8th Grade Comparison

Arapaho

Danes

Exceptional
Exceptional
96.6%
8TH GRADE
99.5/ 100
METRIC RATING
73rd/ 347
METRIC RANK
97.2%
8TH GRADE
100.0/ 100
METRIC RATING
21st/ 347
METRIC RANK

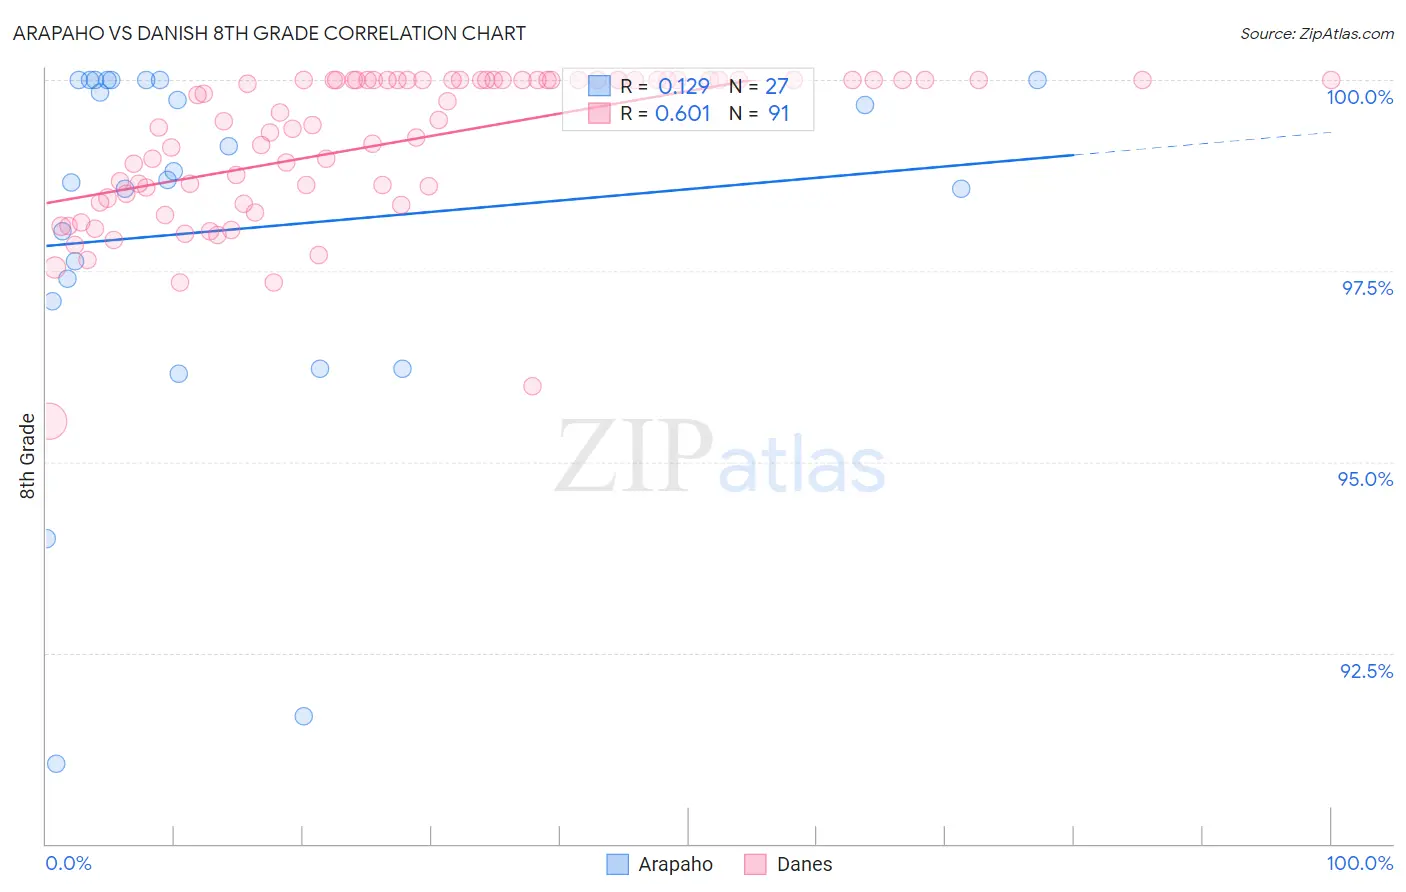
Arapaho vs Danish 8th Grade Correlation Chart

The statistical analysis conducted on geographies consisting of 29,780,325 people shows a poor positive correlation between the proportion of Arapaho and percentage of population with at least 8th grade education in the United States with a correlation coefficient (R) of 0.129 and weighted average of 96.6%. Similarly, the statistical analysis conducted on geographies consisting of 474,193,610 people shows a significant positive correlation between the proportion of Danes and percentage of population with at least 8th grade education in the United States with a correlation coefficient (R) of 0.601 and weighted average of 97.2%, a difference of 0.66%.
Arapaho vs Danish 8th Grade

8th Grade Correlation Summary

MeasurementArapahoDanish
Minimum91.1%95.5%
Maximum100.0%100.0%
Range8.9%4.5%
Mean98.0%99.2%
Median98.7%99.5%
Interquartile 25% (IQ1)97.1%98.5%
Interquartile 75% (IQ3)100.0%100.0%
Interquartile Range (IQR)2.9%1.5%
Standard Deviation (Sample)2.5%0.98%
Standard Deviation (Population)2.4%0.98%

Similar Demographics by 8th Grade

Demographics Similar to Arapaho by 8th Grade

In terms of 8th grade, the demographic groups most similar to Arapaho are New Zealander (96.6%, a difference of 0.0%), Immigrants from England (96.6%, a difference of 0.0%), Immigrants from Ireland (96.5%, a difference of 0.010%), Zimbabwean (96.5%, a difference of 0.020%), and Immigrants from Netherlands (96.5%, a difference of 0.020%).
DemographicsRating | Rank8th Grade
Canadians
99.7
/100
|
#66
Exceptional
96.6%
Iranians
99.7
/100
|
#67
Exceptional
96.6%
Creek
99.7
/100
|
#68
Exceptional
96.6%
Americans
99.7
/100
|
#69
Exceptional
96.6%
Immigrants | Lithuania
99.6
/100
|
#70
Exceptional
96.6%
New Zealanders
99.5
/100
|
#71
Exceptional
96.6%
Immigrants | England
99.5
/100
|
#72
Exceptional
96.6%
Arapaho
99.5
/100
|
#73
Exceptional
96.6%
Immigrants | Ireland
99.5
/100
|
#74
Exceptional
96.5%
Zimbabweans
99.4
/100
|
#75
Exceptional
96.5%
Immigrants | Netherlands
99.4
/100
|
#76
Exceptional
96.5%
Cypriots
99.4
/100
|
#77
Exceptional
96.5%
Yugoslavians
99.4
/100
|
#78
Exceptional
96.5%
Puget Sound Salish
99.3
/100
|
#79
Exceptional
96.5%
Delaware
99.2
/100
|
#80
Exceptional
96.5%

Demographics Similar to Danes by 8th Grade

In terms of 8th grade, the demographic groups most similar to Danes are Croatian (97.2%, a difference of 0.020%), Welsh (97.2%, a difference of 0.030%), French Canadian (97.2%, a difference of 0.030%), Scandinavian (97.2%, a difference of 0.040%), and Czech (97.1%, a difference of 0.050%).
DemographicsRating | Rank8th Grade
English
100.0
/100
|
#14
Exceptional
97.3%
Pennsylvania Germans
100.0
/100
|
#15
Exceptional
97.3%
Tlingit-Haida
100.0
/100
|
#16
Exceptional
97.3%
Irish
100.0
/100
|
#17
Exceptional
97.3%
Lithuanians
100.0
/100
|
#18
Exceptional
97.3%
Scottish
100.0
/100
|
#19
Exceptional
97.3%
Croatians
100.0
/100
|
#20
Exceptional
97.2%
Danes
100.0
/100
|
#21
Exceptional
97.2%
Welsh
100.0
/100
|
#22
Exceptional
97.2%
French Canadians
100.0
/100
|
#23
Exceptional
97.2%
Scandinavians
100.0
/100
|
#24
Exceptional
97.2%
Czechs
100.0
/100
|
#25
Exceptional
97.1%
French
100.0
/100
|
#26
Exceptional
97.1%
Scotch-Irish
100.0
/100
|
#27
Exceptional
97.1%
Italians
100.0
/100
|
#28
Exceptional
97.1%