Alsatian vs Immigrants from Indonesia In Labor Force | Age 25-29
COMPARE
Alsatian
Immigrants from Indonesia
In Labor Force | Age 25-29
In Labor Force | Age 25-29 Comparison
Alsatians
Immigrants from Indonesia
83.9%
IN LABOR FORCE | AGE 25-29
0.7/ 100
METRIC RATING
241st/ 347
METRIC RANK
84.4%
IN LABOR FORCE | AGE 25-29
13.2/ 100
METRIC RATING
208th/ 347
METRIC RANK
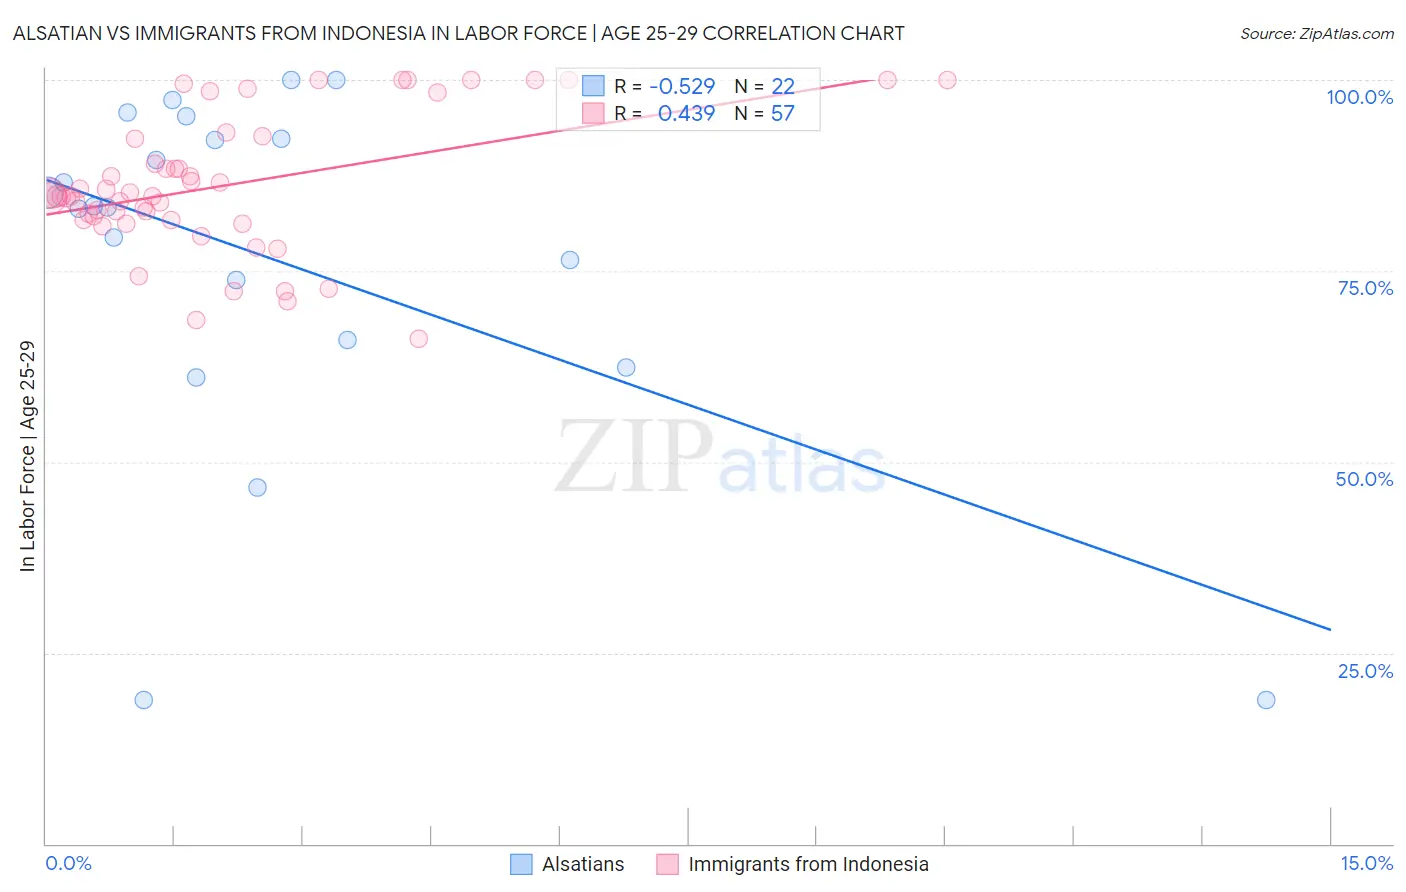
Alsatian vs Immigrants from Indonesia In Labor Force | Age 25-29 Correlation Chart
The statistical analysis conducted on geographies consisting of 82,674,236 people shows a substantial negative correlation between the proportion of Alsatians and labor force participation rate among population between the ages 25 and 29 in the United States with a correlation coefficient (R) of -0.529 and weighted average of 83.9%. Similarly, the statistical analysis conducted on geographies consisting of 215,766,008 people shows a moderate positive correlation between the proportion of Immigrants from Indonesia and labor force participation rate among population between the ages 25 and 29 in the United States with a correlation coefficient (R) of 0.439 and weighted average of 84.4%, a difference of 0.58%.
In Labor Force | Age 25-29 Correlation Summary
| Measurement | Alsatian | Immigrants from Indonesia |
| Minimum | 18.8% | 66.2% |
| Maximum | 100.0% | 100.0% |
| Range | 81.2% | 33.8% |
| Mean | 76.7% | 86.2% |
| Median | 83.4% | 84.8% |
| Interquartile 25% (IQ1) | 66.0% | 81.6% |
| Interquartile 75% (IQ3) | 92.3% | 92.5% |
| Interquartile Range (IQR) | 26.3% | 10.9% |
| Standard Deviation (Sample) | 23.2% | 8.8% |
| Standard Deviation (Population) | 22.7% | 8.8% |
Similar Demographics by In Labor Force | Age 25-29
Demographics Similar to Alsatians by In Labor Force | Age 25-29
In terms of in labor force | age 25-29, the demographic groups most similar to Alsatians are Trinidadian and Tobagonian (83.9%, a difference of 0.020%), Immigrants from Uzbekistan (83.9%, a difference of 0.030%), Jamaican (83.9%, a difference of 0.030%), U.S. Virgin Islander (83.8%, a difference of 0.030%), and Salvadoran (83.8%, a difference of 0.040%).
| Demographics | Rating | Rank | In Labor Force | Age 25-29 |
| Barbadians | 1.0 /100 | #234 | Tragic 83.9% |
| Iraqis | 0.9 /100 | #235 | Tragic 83.9% |
| Guamanians/Chamorros | 0.9 /100 | #236 | Tragic 83.9% |
| Immigrants | Immigrants | 0.9 /100 | #237 | Tragic 83.9% |
| Immigrants | Uzbekistan | 0.8 /100 | #238 | Tragic 83.9% |
| Jamaicans | 0.8 /100 | #239 | Tragic 83.9% |
| Trinidadians and Tobagonians | 0.7 /100 | #240 | Tragic 83.9% |
| Alsatians | 0.7 /100 | #241 | Tragic 83.9% |
| U.S. Virgin Islanders | 0.6 /100 | #242 | Tragic 83.8% |
| Salvadorans | 0.5 /100 | #243 | Tragic 83.8% |
| Immigrants | Jamaica | 0.4 /100 | #244 | Tragic 83.8% |
| Iroquois | 0.4 /100 | #245 | Tragic 83.8% |
| Cree | 0.3 /100 | #246 | Tragic 83.8% |
| Immigrants | El Salvador | 0.3 /100 | #247 | Tragic 83.7% |
| Immigrants | Nonimmigrants | 0.3 /100 | #248 | Tragic 83.7% |
Demographics Similar to Immigrants from Indonesia by In Labor Force | Age 25-29
In terms of in labor force | age 25-29, the demographic groups most similar to Immigrants from Indonesia are Immigrants from Armenia (84.4%, a difference of 0.0%), Immigrants from Jordan (84.4%, a difference of 0.010%), Chinese (84.3%, a difference of 0.010%), Immigrants from Venezuela (84.3%, a difference of 0.010%), and Immigrants from Cambodia (84.4%, a difference of 0.020%).
| Demographics | Rating | Rank | In Labor Force | Age 25-29 |
| Laotians | 16.6 /100 | #201 | Poor 84.4% |
| Afghans | 15.9 /100 | #202 | Poor 84.4% |
| Immigrants | Afghanistan | 15.6 /100 | #203 | Poor 84.4% |
| Venezuelans | 15.1 /100 | #204 | Poor 84.4% |
| Ecuadorians | 14.8 /100 | #205 | Poor 84.4% |
| Immigrants | Cambodia | 14.3 /100 | #206 | Poor 84.4% |
| Immigrants | Armenia | 13.3 /100 | #207 | Poor 84.4% |
| Immigrants | Indonesia | 13.2 /100 | #208 | Poor 84.4% |
| Immigrants | Jordan | 12.8 /100 | #209 | Poor 84.4% |
| Chinese | 12.7 /100 | #210 | Poor 84.3% |
| Immigrants | Venezuela | 12.6 /100 | #211 | Poor 84.3% |
| Sub-Saharan Africans | 11.7 /100 | #212 | Poor 84.3% |
| Japanese | 11.4 /100 | #213 | Poor 84.3% |
| Lebanese | 11.1 /100 | #214 | Poor 84.3% |
| Immigrants | Syria | 10.7 /100 | #215 | Poor 84.3% |