Albanian vs Croatian In Labor Force | Age 25-29
COMPARE
Albanian
Croatian
In Labor Force | Age 25-29
In Labor Force | Age 25-29 Comparison
Albanians
Croatians
85.5%
IN LABOR FORCE | AGE 25-29
99.7/ 100
METRIC RATING
54th/ 347
METRIC RANK
85.8%
IN LABOR FORCE | AGE 25-29
99.9/ 100
METRIC RATING
39th/ 347
METRIC RANK
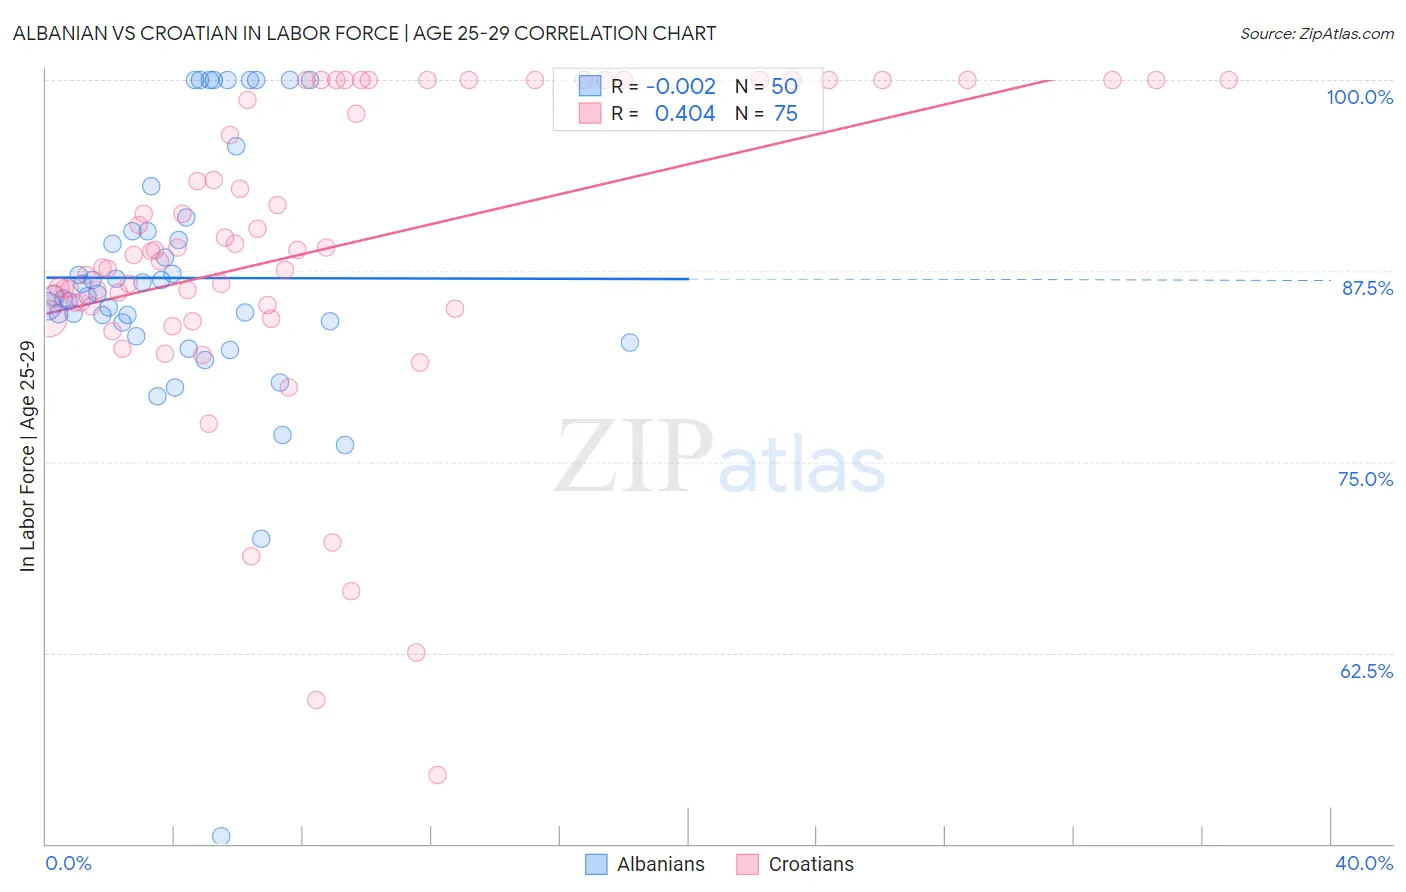
Albanian vs Croatian In Labor Force | Age 25-29 Correlation Chart
The statistical analysis conducted on geographies consisting of 193,233,766 people shows no correlation between the proportion of Albanians and labor force participation rate among population between the ages 25 and 29 in the United States with a correlation coefficient (R) of -0.002 and weighted average of 85.5%. Similarly, the statistical analysis conducted on geographies consisting of 375,575,461 people shows a moderate positive correlation between the proportion of Croatians and labor force participation rate among population between the ages 25 and 29 in the United States with a correlation coefficient (R) of 0.404 and weighted average of 85.8%, a difference of 0.24%.
In Labor Force | Age 25-29 Correlation Summary
| Measurement | Albanian | Croatian |
| Minimum | 50.5% | 54.5% |
| Maximum | 100.0% | 100.0% |
| Range | 49.5% | 45.5% |
| Mean | 87.0% | 88.9% |
| Median | 85.9% | 88.8% |
| Interquartile 25% (IQ1) | 84.2% | 85.2% |
| Interquartile 75% (IQ3) | 90.1% | 100.0% |
| Interquartile Range (IQR) | 5.9% | 14.8% |
| Standard Deviation (Sample) | 8.9% | 10.0% |
| Standard Deviation (Population) | 8.8% | 10.0% |
Demographics Similar to Albanians and Croatians by In Labor Force | Age 25-29
In terms of in labor force | age 25-29, the demographic groups most similar to Albanians are Belgian (85.5%, a difference of 0.0%), Immigrants from Brazil (85.5%, a difference of 0.010%), Immigrants from Poland (85.6%, a difference of 0.030%), Eastern European (85.5%, a difference of 0.040%), and Yugoslavian (85.6%, a difference of 0.050%). Similarly, the demographic groups most similar to Croatians are Sierra Leonean (85.8%, a difference of 0.0%), Immigrants from Albania (85.7%, a difference of 0.020%), Polish (85.8%, a difference of 0.030%), Immigrants from Greece (85.7%, a difference of 0.030%), and Immigrants from Nepal (85.8%, a difference of 0.050%).
| Demographics | Rating | Rank | In Labor Force | Age 25-29 |
| Immigrants | Nepal | 99.9 /100 | #36 | Exceptional 85.8% |
| Poles | 99.9 /100 | #37 | Exceptional 85.8% |
| Sierra Leoneans | 99.9 /100 | #38 | Exceptional 85.8% |
| Croatians | 99.9 /100 | #39 | Exceptional 85.8% |
| Immigrants | Albania | 99.9 /100 | #40 | Exceptional 85.7% |
| Immigrants | Greece | 99.9 /100 | #41 | Exceptional 85.7% |
| Immigrants | Eritrea | 99.9 /100 | #42 | Exceptional 85.7% |
| Immigrants | India | 99.9 /100 | #43 | Exceptional 85.7% |
| Macedonians | 99.9 /100 | #44 | Exceptional 85.7% |
| Immigrants | Sierra Leone | 99.9 /100 | #45 | Exceptional 85.7% |
| Czechs | 99.8 /100 | #46 | Exceptional 85.6% |
| Turks | 99.8 /100 | #47 | Exceptional 85.6% |
| Italians | 99.8 /100 | #48 | Exceptional 85.6% |
| Swedes | 99.8 /100 | #49 | Exceptional 85.6% |
| Yugoslavians | 99.8 /100 | #50 | Exceptional 85.6% |
| Immigrants | Latvia | 99.8 /100 | #51 | Exceptional 85.6% |
| Immigrants | Poland | 99.7 /100 | #52 | Exceptional 85.6% |
| Belgians | 99.7 /100 | #53 | Exceptional 85.5% |
| Albanians | 99.7 /100 | #54 | Exceptional 85.5% |
| Immigrants | Brazil | 99.7 /100 | #55 | Exceptional 85.5% |
| Eastern Europeans | 99.6 /100 | #56 | Exceptional 85.5% |