Albanian vs Malaysian In Labor Force | Age 25-29
COMPARE
Albanian
Malaysian
In Labor Force | Age 25-29
In Labor Force | Age 25-29 Comparison
Albanians
Malaysians
85.5%
IN LABOR FORCE | AGE 25-29
99.7/ 100
METRIC RATING
54th/ 347
METRIC RANK
84.6%
IN LABOR FORCE | AGE 25-29
46.8/ 100
METRIC RATING
176th/ 347
METRIC RANK
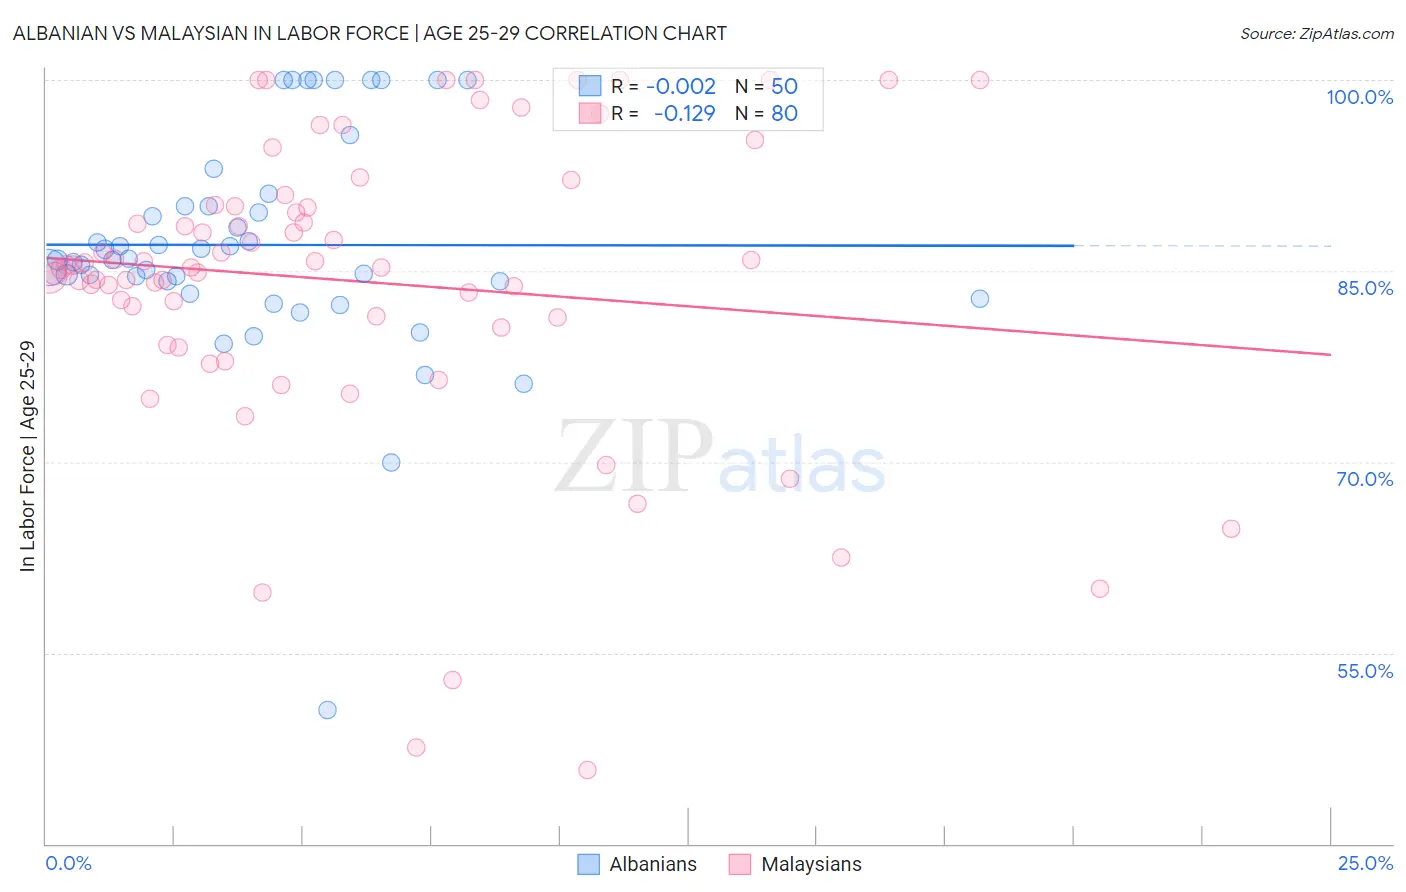
Albanian vs Malaysian In Labor Force | Age 25-29 Correlation Chart
The statistical analysis conducted on geographies consisting of 193,233,766 people shows no correlation between the proportion of Albanians and labor force participation rate among population between the ages 25 and 29 in the United States with a correlation coefficient (R) of -0.002 and weighted average of 85.5%. Similarly, the statistical analysis conducted on geographies consisting of 226,081,957 people shows a poor negative correlation between the proportion of Malaysians and labor force participation rate among population between the ages 25 and 29 in the United States with a correlation coefficient (R) of -0.129 and weighted average of 84.6%, a difference of 1.1%.
In Labor Force | Age 25-29 Correlation Summary
| Measurement | Albanian | Malaysian |
| Minimum | 50.5% | 45.8% |
| Maximum | 100.0% | 100.0% |
| Range | 49.5% | 54.2% |
| Mean | 87.0% | 84.2% |
| Median | 85.9% | 85.4% |
| Interquartile 25% (IQ1) | 84.2% | 80.9% |
| Interquartile 75% (IQ3) | 90.1% | 90.1% |
| Interquartile Range (IQR) | 5.9% | 9.2% |
| Standard Deviation (Sample) | 8.9% | 11.8% |
| Standard Deviation (Population) | 8.8% | 11.7% |
Similar Demographics by In Labor Force | Age 25-29
Demographics Similar to Albanians by In Labor Force | Age 25-29
In terms of in labor force | age 25-29, the demographic groups most similar to Albanians are Belgian (85.5%, a difference of 0.0%), Immigrants from Brazil (85.5%, a difference of 0.010%), Immigrants from Poland (85.6%, a difference of 0.030%), Eastern European (85.5%, a difference of 0.040%), and Yugoslavian (85.6%, a difference of 0.050%).
| Demographics | Rating | Rank | In Labor Force | Age 25-29 |
| Turks | 99.8 /100 | #47 | Exceptional 85.6% |
| Italians | 99.8 /100 | #48 | Exceptional 85.6% |
| Swedes | 99.8 /100 | #49 | Exceptional 85.6% |
| Yugoslavians | 99.8 /100 | #50 | Exceptional 85.6% |
| Immigrants | Latvia | 99.8 /100 | #51 | Exceptional 85.6% |
| Immigrants | Poland | 99.7 /100 | #52 | Exceptional 85.6% |
| Belgians | 99.7 /100 | #53 | Exceptional 85.5% |
| Albanians | 99.7 /100 | #54 | Exceptional 85.5% |
| Immigrants | Brazil | 99.7 /100 | #55 | Exceptional 85.5% |
| Eastern Europeans | 99.6 /100 | #56 | Exceptional 85.5% |
| Estonians | 99.6 /100 | #57 | Exceptional 85.5% |
| Greeks | 99.6 /100 | #58 | Exceptional 85.5% |
| Immigrants | Morocco | 99.5 /100 | #59 | Exceptional 85.5% |
| Thais | 99.5 /100 | #60 | Exceptional 85.5% |
| Serbians | 99.5 /100 | #61 | Exceptional 85.5% |
Demographics Similar to Malaysians by In Labor Force | Age 25-29
In terms of in labor force | age 25-29, the demographic groups most similar to Malaysians are Hungarian (84.6%, a difference of 0.010%), Immigrants from China (84.6%, a difference of 0.010%), Immigrants from Thailand (84.6%, a difference of 0.010%), Assyrian/Chaldean/Syriac (84.7%, a difference of 0.020%), and Palestinian (84.7%, a difference of 0.020%).
| Demographics | Rating | Rank | In Labor Force | Age 25-29 |
| Celtics | 52.5 /100 | #169 | Average 84.7% |
| Tongans | 52.4 /100 | #170 | Average 84.7% |
| Immigrants | Vietnam | 50.5 /100 | #171 | Average 84.7% |
| Immigrants | Western Europe | 50.4 /100 | #172 | Average 84.7% |
| Assyrians/Chaldeans/Syriacs | 50.2 /100 | #173 | Average 84.7% |
| Palestinians | 50.0 /100 | #174 | Average 84.7% |
| Hungarians | 47.8 /100 | #175 | Average 84.6% |
| Malaysians | 46.8 /100 | #176 | Average 84.6% |
| Immigrants | China | 45.7 /100 | #177 | Average 84.6% |
| Immigrants | Thailand | 45.2 /100 | #178 | Average 84.6% |
| Immigrants | Argentina | 44.0 /100 | #179 | Average 84.6% |
| Immigrants | South America | 42.9 /100 | #180 | Average 84.6% |
| Immigrants | Norway | 41.9 /100 | #181 | Average 84.6% |
| Europeans | 40.3 /100 | #182 | Average 84.6% |
| Scottish | 40.1 /100 | #183 | Average 84.6% |