Alaska Native vs Immigrants from Nepal In Labor Force | Age 20-64
COMPARE
Alaska Native
Immigrants from Nepal
In Labor Force | Age 20-64
In Labor Force | Age 20-64 Comparison
Alaska Natives
Immigrants from Nepal
77.0%
IN LABOR FORCE | AGE 20-64
0.0/ 100
METRIC RATING
308th/ 347
METRIC RANK
81.1%
IN LABOR FORCE | AGE 20-64
100.0/ 100
METRIC RATING
16th/ 347
METRIC RANK
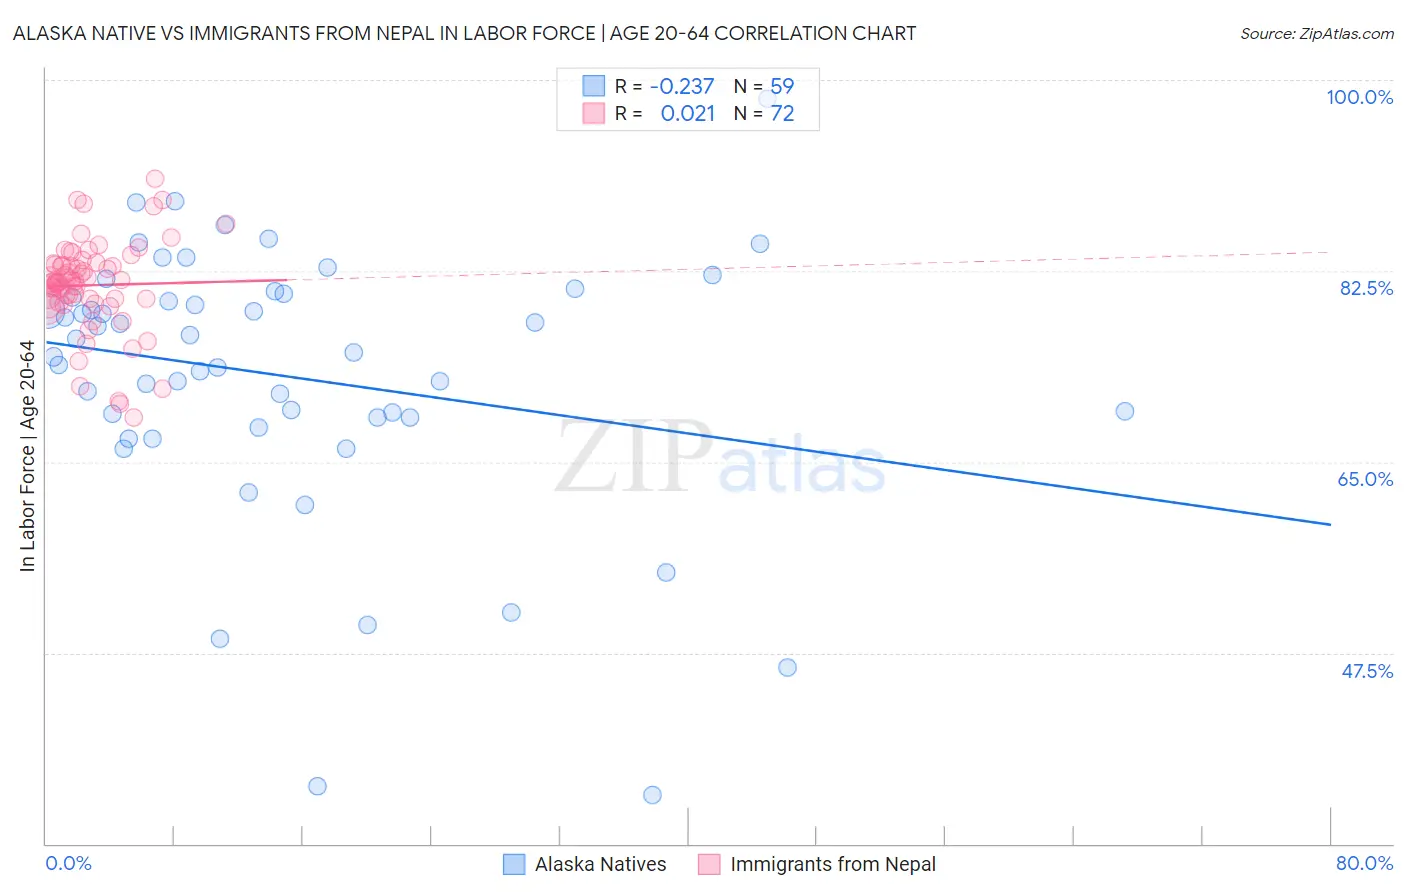
Alaska Native vs Immigrants from Nepal In Labor Force | Age 20-64 Correlation Chart
The statistical analysis conducted on geographies consisting of 76,778,887 people shows a weak negative correlation between the proportion of Alaska Natives and labor force participation rate among population between the ages 20 and 64 in the United States with a correlation coefficient (R) of -0.237 and weighted average of 77.0%. Similarly, the statistical analysis conducted on geographies consisting of 186,792,250 people shows no correlation between the proportion of Immigrants from Nepal and labor force participation rate among population between the ages 20 and 64 in the United States with a correlation coefficient (R) of 0.021 and weighted average of 81.1%, a difference of 5.2%.
In Labor Force | Age 20-64 Correlation Summary
| Measurement | Alaska Native | Immigrants from Nepal |
| Minimum | 34.5% | 69.1% |
| Maximum | 98.3% | 90.9% |
| Range | 63.8% | 21.8% |
| Mean | 72.8% | 81.2% |
| Median | 75.0% | 81.5% |
| Interquartile 25% (IQ1) | 69.1% | 79.8% |
| Interquartile 75% (IQ3) | 80.4% | 83.1% |
| Interquartile Range (IQR) | 11.3% | 3.3% |
| Standard Deviation (Sample) | 12.4% | 4.2% |
| Standard Deviation (Population) | 12.3% | 4.2% |
Similar Demographics by In Labor Force | Age 20-64
Demographics Similar to Alaska Natives by In Labor Force | Age 20-64
In terms of in labor force | age 20-64, the demographic groups most similar to Alaska Natives are American (77.0%, a difference of 0.010%), Comanche (77.0%, a difference of 0.020%), Central American Indian (77.1%, a difference of 0.060%), Blackfeet (77.0%, a difference of 0.060%), and Potawatomi (77.2%, a difference of 0.23%).
| Demographics | Rating | Rank | In Labor Force | Age 20-64 |
| Nepalese | 0.0 /100 | #301 | Tragic 77.5% |
| Iroquois | 0.0 /100 | #302 | Tragic 77.5% |
| Chippewa | 0.0 /100 | #303 | Tragic 77.3% |
| Immigrants | Mexico | 0.0 /100 | #304 | Tragic 77.3% |
| Mexicans | 0.0 /100 | #305 | Tragic 77.2% |
| Potawatomi | 0.0 /100 | #306 | Tragic 77.2% |
| Central American Indians | 0.0 /100 | #307 | Tragic 77.1% |
| Alaska Natives | 0.0 /100 | #308 | Tragic 77.0% |
| Americans | 0.0 /100 | #309 | Tragic 77.0% |
| Comanche | 0.0 /100 | #310 | Tragic 77.0% |
| Blackfeet | 0.0 /100 | #311 | Tragic 77.0% |
| Alaskan Athabascans | 0.0 /100 | #312 | Tragic 76.9% |
| Shoshone | 0.0 /100 | #313 | Tragic 76.8% |
| Blacks/African Americans | 0.0 /100 | #314 | Tragic 76.8% |
| Ottawa | 0.0 /100 | #315 | Tragic 76.7% |
Demographics Similar to Immigrants from Nepal by In Labor Force | Age 20-64
In terms of in labor force | age 20-64, the demographic groups most similar to Immigrants from Nepal are Bulgarian (81.1%, a difference of 0.0%), Cambodian (81.1%, a difference of 0.020%), Norwegian (81.0%, a difference of 0.11%), Immigrants from Bulgaria (81.0%, a difference of 0.12%), and Zimbabwean (81.0%, a difference of 0.12%).
| Demographics | Rating | Rank | In Labor Force | Age 20-64 |
| Sierra Leoneans | 100.0 /100 | #9 | Exceptional 81.5% |
| Immigrants | Sierra Leone | 100.0 /100 | #10 | Exceptional 81.5% |
| Immigrants | Eastern Africa | 100.0 /100 | #11 | Exceptional 81.3% |
| Immigrants | Eritrea | 100.0 /100 | #12 | Exceptional 81.3% |
| Immigrants | India | 100.0 /100 | #13 | Exceptional 81.3% |
| Cambodians | 100.0 /100 | #14 | Exceptional 81.1% |
| Bulgarians | 100.0 /100 | #15 | Exceptional 81.1% |
| Immigrants | Nepal | 100.0 /100 | #16 | Exceptional 81.1% |
| Norwegians | 100.0 /100 | #17 | Exceptional 81.0% |
| Immigrants | Bulgaria | 100.0 /100 | #18 | Exceptional 81.0% |
| Zimbabweans | 100.0 /100 | #19 | Exceptional 81.0% |
| Thais | 100.0 /100 | #20 | Exceptional 80.9% |
| Liberians | 100.0 /100 | #21 | Exceptional 80.9% |
| Sudanese | 100.0 /100 | #22 | Exceptional 80.8% |
| Immigrants | Bosnia and Herzegovina | 100.0 /100 | #23 | Exceptional 80.8% |