Alaska Native vs Immigrants from South Eastern Asia In Labor Force | Age 20-64
COMPARE
Alaska Native
Immigrants from South Eastern Asia
In Labor Force | Age 20-64
In Labor Force | Age 20-64 Comparison
Alaska Natives
Immigrants from South Eastern Asia
77.0%
IN LABOR FORCE | AGE 20-64
0.0/ 100
METRIC RATING
308th/ 347
METRIC RANK
79.8%
IN LABOR FORCE | AGE 20-64
80.4/ 100
METRIC RATING
140th/ 347
METRIC RANK
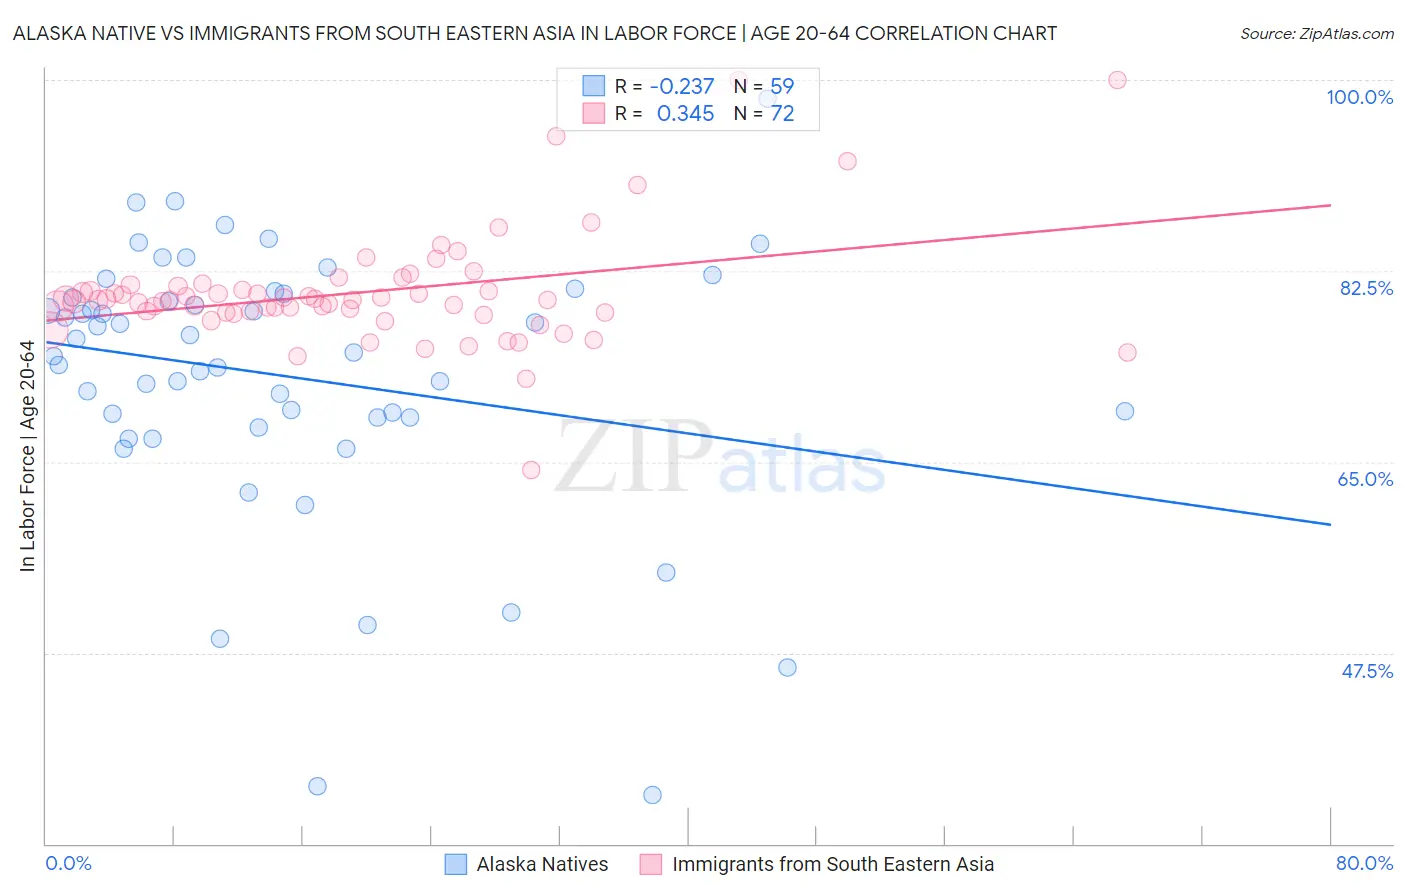
Alaska Native vs Immigrants from South Eastern Asia In Labor Force | Age 20-64 Correlation Chart
The statistical analysis conducted on geographies consisting of 76,778,887 people shows a weak negative correlation between the proportion of Alaska Natives and labor force participation rate among population between the ages 20 and 64 in the United States with a correlation coefficient (R) of -0.237 and weighted average of 77.0%. Similarly, the statistical analysis conducted on geographies consisting of 512,697,345 people shows a mild positive correlation between the proportion of Immigrants from South Eastern Asia and labor force participation rate among population between the ages 20 and 64 in the United States with a correlation coefficient (R) of 0.345 and weighted average of 79.8%, a difference of 3.6%.
In Labor Force | Age 20-64 Correlation Summary
| Measurement | Alaska Native | Immigrants from South Eastern Asia |
| Minimum | 34.5% | 64.3% |
| Maximum | 98.3% | 100.0% |
| Range | 63.8% | 35.7% |
| Mean | 72.8% | 80.5% |
| Median | 75.0% | 79.8% |
| Interquartile 25% (IQ1) | 69.1% | 78.7% |
| Interquartile 75% (IQ3) | 80.4% | 80.9% |
| Interquartile Range (IQR) | 11.3% | 2.2% |
| Standard Deviation (Sample) | 12.4% | 5.3% |
| Standard Deviation (Population) | 12.3% | 5.2% |
Similar Demographics by In Labor Force | Age 20-64
Demographics Similar to Alaska Natives by In Labor Force | Age 20-64
In terms of in labor force | age 20-64, the demographic groups most similar to Alaska Natives are American (77.0%, a difference of 0.010%), Comanche (77.0%, a difference of 0.020%), Central American Indian (77.1%, a difference of 0.060%), Blackfeet (77.0%, a difference of 0.060%), and Potawatomi (77.2%, a difference of 0.23%).
| Demographics | Rating | Rank | In Labor Force | Age 20-64 |
| Nepalese | 0.0 /100 | #301 | Tragic 77.5% |
| Iroquois | 0.0 /100 | #302 | Tragic 77.5% |
| Chippewa | 0.0 /100 | #303 | Tragic 77.3% |
| Immigrants | Mexico | 0.0 /100 | #304 | Tragic 77.3% |
| Mexicans | 0.0 /100 | #305 | Tragic 77.2% |
| Potawatomi | 0.0 /100 | #306 | Tragic 77.2% |
| Central American Indians | 0.0 /100 | #307 | Tragic 77.1% |
| Alaska Natives | 0.0 /100 | #308 | Tragic 77.0% |
| Americans | 0.0 /100 | #309 | Tragic 77.0% |
| Comanche | 0.0 /100 | #310 | Tragic 77.0% |
| Blackfeet | 0.0 /100 | #311 | Tragic 77.0% |
| Alaskan Athabascans | 0.0 /100 | #312 | Tragic 76.9% |
| Shoshone | 0.0 /100 | #313 | Tragic 76.8% |
| Blacks/African Americans | 0.0 /100 | #314 | Tragic 76.8% |
| Ottawa | 0.0 /100 | #315 | Tragic 76.7% |
Demographics Similar to Immigrants from South Eastern Asia by In Labor Force | Age 20-64
In terms of in labor force | age 20-64, the demographic groups most similar to Immigrants from South Eastern Asia are Immigrants from Israel (79.8%, a difference of 0.0%), Slovak (79.8%, a difference of 0.010%), Immigrants from Sweden (79.8%, a difference of 0.010%), Korean (79.8%, a difference of 0.010%), and Pakistani (79.8%, a difference of 0.010%).
| Demographics | Rating | Rank | In Labor Force | Age 20-64 |
| South American Indians | 87.6 /100 | #133 | Excellent 79.9% |
| Belgians | 87.4 /100 | #134 | Excellent 79.9% |
| Ukrainians | 86.8 /100 | #135 | Excellent 79.9% |
| Immigrants | Singapore | 86.7 /100 | #136 | Excellent 79.9% |
| Immigrants | Ukraine | 86.5 /100 | #137 | Excellent 79.9% |
| Immigrants | Nigeria | 86.4 /100 | #138 | Excellent 79.9% |
| Immigrants | Spain | 83.9 /100 | #139 | Excellent 79.8% |
| Immigrants | South Eastern Asia | 80.4 /100 | #140 | Excellent 79.8% |
| Immigrants | Israel | 80.0 /100 | #141 | Good 79.8% |
| Slovaks | 79.9 /100 | #142 | Good 79.8% |
| Immigrants | Sweden | 79.7 /100 | #143 | Good 79.8% |
| Koreans | 79.6 /100 | #144 | Good 79.8% |
| Pakistanis | 79.3 /100 | #145 | Good 79.8% |
| Immigrants | Southern Europe | 78.9 /100 | #146 | Good 79.8% |
| Immigrants | Philippines | 78.0 /100 | #147 | Good 79.8% |