Alaska Native vs Immigrants from Fiji In Labor Force | Age 20-64
COMPARE
Alaska Native
Immigrants from Fiji
In Labor Force | Age 20-64
In Labor Force | Age 20-64 Comparison
Alaska Natives
Immigrants from Fiji
77.0%
IN LABOR FORCE | AGE 20-64
0.0/ 100
METRIC RATING
308th/ 347
METRIC RANK
78.6%
IN LABOR FORCE | AGE 20-64
0.3/ 100
METRIC RATING
260th/ 347
METRIC RANK
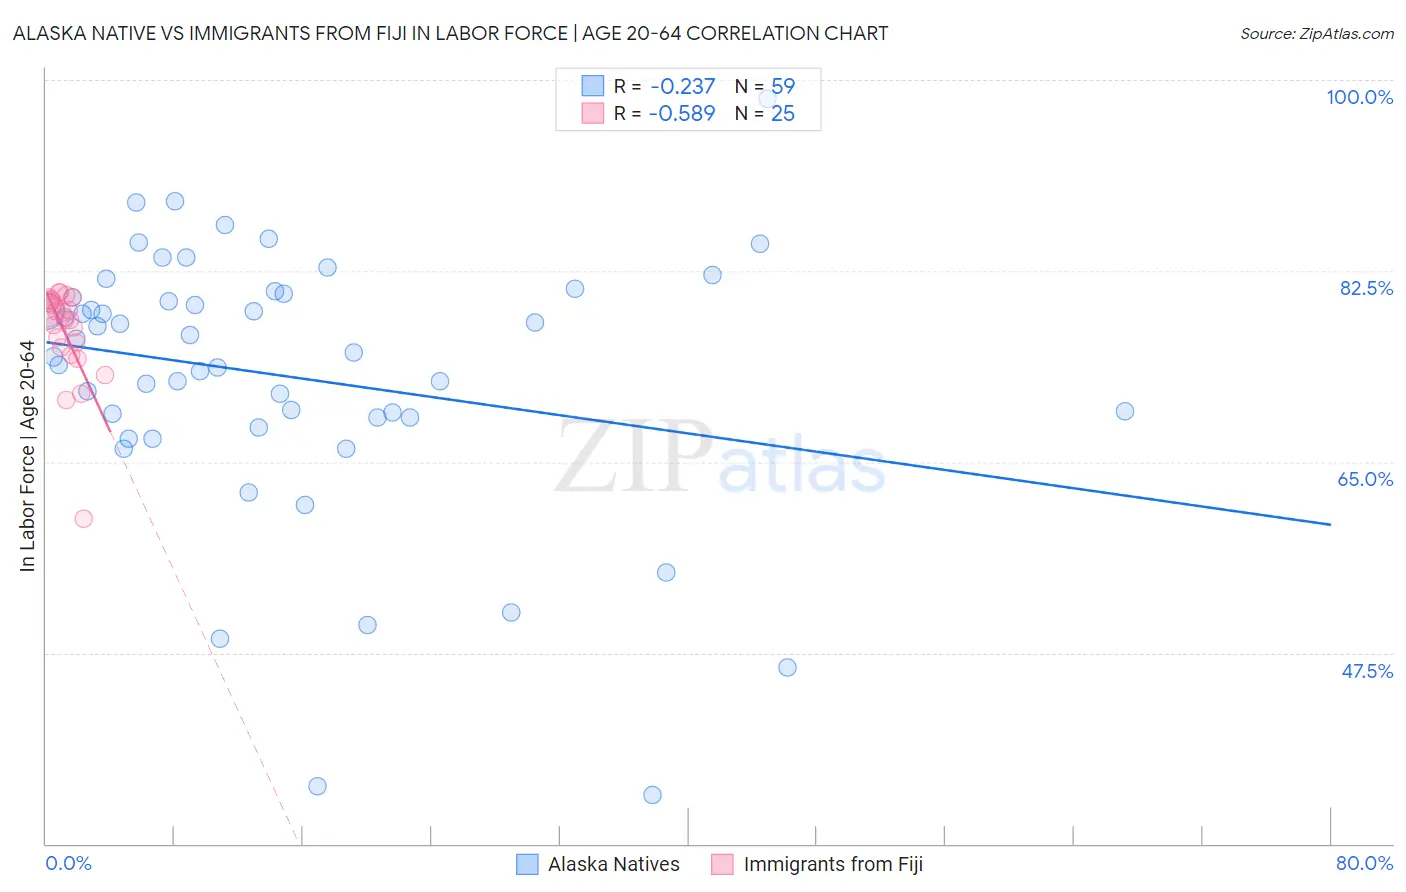
Alaska Native vs Immigrants from Fiji In Labor Force | Age 20-64 Correlation Chart
The statistical analysis conducted on geographies consisting of 76,778,887 people shows a weak negative correlation between the proportion of Alaska Natives and labor force participation rate among population between the ages 20 and 64 in the United States with a correlation coefficient (R) of -0.237 and weighted average of 77.0%. Similarly, the statistical analysis conducted on geographies consisting of 93,756,016 people shows a substantial negative correlation between the proportion of Immigrants from Fiji and labor force participation rate among population between the ages 20 and 64 in the United States with a correlation coefficient (R) of -0.589 and weighted average of 78.6%, a difference of 2.0%.
In Labor Force | Age 20-64 Correlation Summary
| Measurement | Alaska Native | Immigrants from Fiji |
| Minimum | 34.5% | 59.8% |
| Maximum | 98.3% | 80.6% |
| Range | 63.8% | 20.8% |
| Mean | 72.8% | 76.7% |
| Median | 75.0% | 78.0% |
| Interquartile 25% (IQ1) | 69.1% | 75.2% |
| Interquartile 75% (IQ3) | 80.4% | 79.7% |
| Interquartile Range (IQR) | 11.3% | 4.5% |
| Standard Deviation (Sample) | 12.4% | 4.5% |
| Standard Deviation (Population) | 12.3% | 4.4% |
Similar Demographics by In Labor Force | Age 20-64
Demographics Similar to Alaska Natives by In Labor Force | Age 20-64
In terms of in labor force | age 20-64, the demographic groups most similar to Alaska Natives are American (77.0%, a difference of 0.010%), Comanche (77.0%, a difference of 0.020%), Central American Indian (77.1%, a difference of 0.060%), Blackfeet (77.0%, a difference of 0.060%), and Potawatomi (77.2%, a difference of 0.23%).
| Demographics | Rating | Rank | In Labor Force | Age 20-64 |
| Nepalese | 0.0 /100 | #301 | Tragic 77.5% |
| Iroquois | 0.0 /100 | #302 | Tragic 77.5% |
| Chippewa | 0.0 /100 | #303 | Tragic 77.3% |
| Immigrants | Mexico | 0.0 /100 | #304 | Tragic 77.3% |
| Mexicans | 0.0 /100 | #305 | Tragic 77.2% |
| Potawatomi | 0.0 /100 | #306 | Tragic 77.2% |
| Central American Indians | 0.0 /100 | #307 | Tragic 77.1% |
| Alaska Natives | 0.0 /100 | #308 | Tragic 77.0% |
| Americans | 0.0 /100 | #309 | Tragic 77.0% |
| Comanche | 0.0 /100 | #310 | Tragic 77.0% |
| Blackfeet | 0.0 /100 | #311 | Tragic 77.0% |
| Alaskan Athabascans | 0.0 /100 | #312 | Tragic 76.9% |
| Shoshone | 0.0 /100 | #313 | Tragic 76.8% |
| Blacks/African Americans | 0.0 /100 | #314 | Tragic 76.8% |
| Ottawa | 0.0 /100 | #315 | Tragic 76.7% |
Demographics Similar to Immigrants from Fiji by In Labor Force | Age 20-64
In terms of in labor force | age 20-64, the demographic groups most similar to Immigrants from Fiji are Tsimshian (78.7%, a difference of 0.070%), Guatemalan (78.7%, a difference of 0.11%), Immigrants from Guatemala (78.7%, a difference of 0.11%), White/Caucasian (78.5%, a difference of 0.11%), and Hawaiian (78.7%, a difference of 0.13%).
| Demographics | Rating | Rank | In Labor Force | Age 20-64 |
| Basques | 0.5 /100 | #253 | Tragic 78.7% |
| Immigrants | Lebanon | 0.5 /100 | #254 | Tragic 78.7% |
| Hawaiians | 0.5 /100 | #255 | Tragic 78.7% |
| Celtics | 0.5 /100 | #256 | Tragic 78.7% |
| Guatemalans | 0.4 /100 | #257 | Tragic 78.7% |
| Immigrants | Guatemala | 0.4 /100 | #258 | Tragic 78.7% |
| Tsimshian | 0.4 /100 | #259 | Tragic 78.7% |
| Immigrants | Fiji | 0.3 /100 | #260 | Tragic 78.6% |
| Whites/Caucasians | 0.2 /100 | #261 | Tragic 78.5% |
| Fijians | 0.1 /100 | #262 | Tragic 78.4% |
| Pennsylvania Germans | 0.1 /100 | #263 | Tragic 78.4% |
| Spaniards | 0.1 /100 | #264 | Tragic 78.4% |
| British West Indians | 0.1 /100 | #265 | Tragic 78.4% |
| Bahamians | 0.1 /100 | #266 | Tragic 78.4% |
| U.S. Virgin Islanders | 0.1 /100 | #267 | Tragic 78.4% |