Alaska Native vs Immigrants from Honduras In Labor Force | Age 35-44
COMPARE
Alaska Native
Immigrants from Honduras
In Labor Force | Age 35-44
In Labor Force | Age 35-44 Comparison
Alaska Natives
Immigrants from Honduras
81.6%
IN LABOR FORCE | AGE 35-44
0.0/ 100
METRIC RATING
312th/ 347
METRIC RANK
83.3%
IN LABOR FORCE | AGE 35-44
0.0/ 100
METRIC RATING
270th/ 347
METRIC RANK
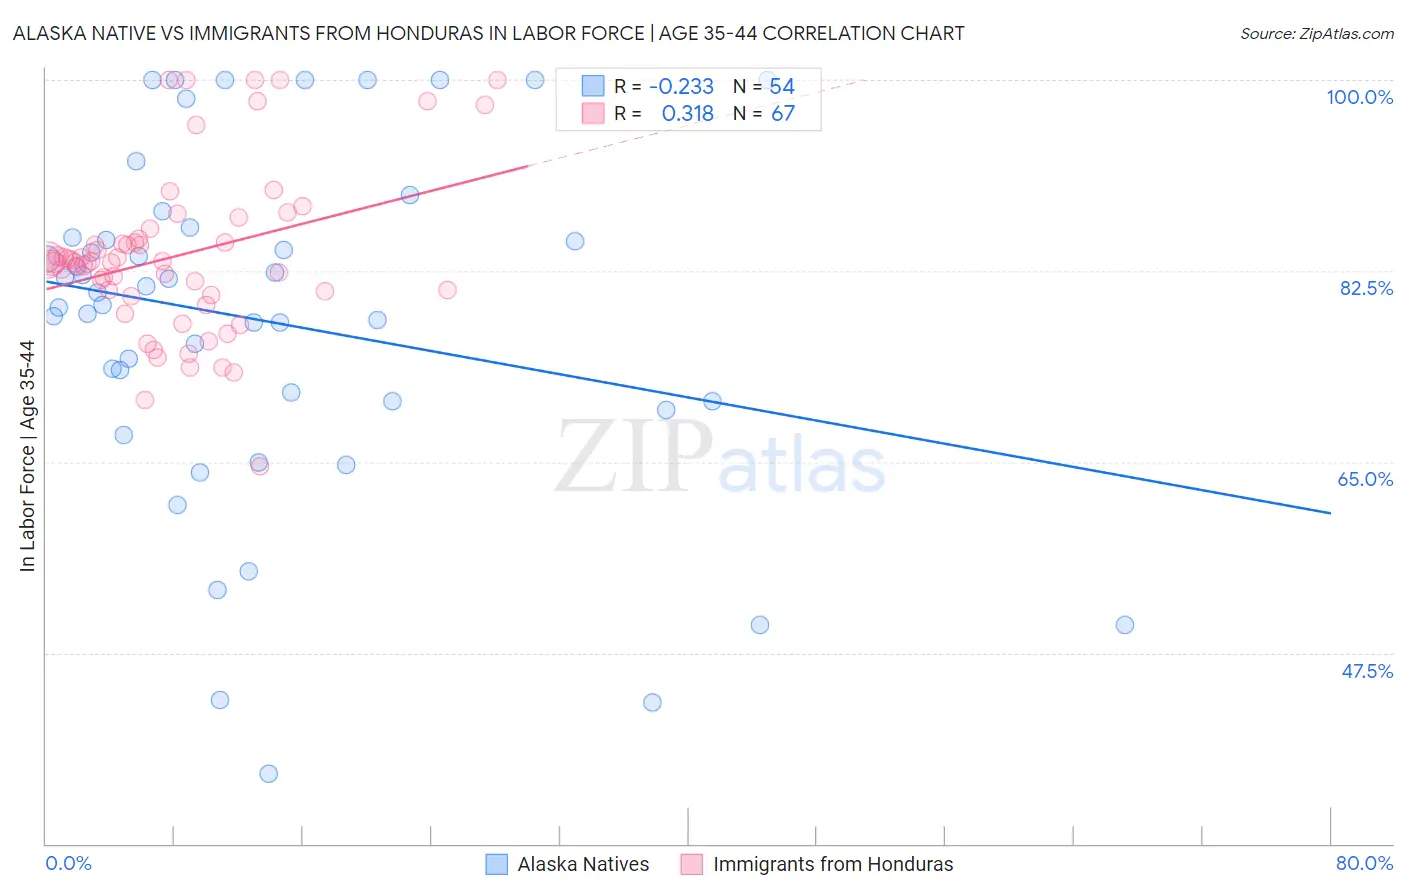
Alaska Native vs Immigrants from Honduras In Labor Force | Age 35-44 Correlation Chart
The statistical analysis conducted on geographies consisting of 76,764,235 people shows a weak negative correlation between the proportion of Alaska Natives and labor force participation rate among population between the ages 35 and 44 in the United States with a correlation coefficient (R) of -0.233 and weighted average of 81.6%. Similarly, the statistical analysis conducted on geographies consisting of 322,503,020 people shows a mild positive correlation between the proportion of Immigrants from Honduras and labor force participation rate among population between the ages 35 and 44 in the United States with a correlation coefficient (R) of 0.318 and weighted average of 83.3%, a difference of 2.0%.
In Labor Force | Age 35-44 Correlation Summary
| Measurement | Alaska Native | Immigrants from Honduras |
| Minimum | 36.4% | 64.6% |
| Maximum | 100.0% | 100.0% |
| Range | 63.6% | 35.4% |
| Mean | 77.8% | 83.9% |
| Median | 79.9% | 83.3% |
| Interquartile 25% (IQ1) | 70.5% | 80.3% |
| Interquartile 75% (IQ3) | 85.5% | 85.5% |
| Interquartile Range (IQR) | 15.0% | 5.2% |
| Standard Deviation (Sample) | 15.9% | 7.5% |
| Standard Deviation (Population) | 15.7% | 7.4% |
Similar Demographics by In Labor Force | Age 35-44
Demographics Similar to Alaska Natives by In Labor Force | Age 35-44
In terms of in labor force | age 35-44, the demographic groups most similar to Alaska Natives are Mexican (81.6%, a difference of 0.0%), Cajun (81.5%, a difference of 0.12%), Colville (81.7%, a difference of 0.14%), Immigrants from Mexico (81.5%, a difference of 0.14%), and Comanche (81.5%, a difference of 0.16%).
| Demographics | Rating | Rank | In Labor Force | Age 35-44 |
| Shoshone | 0.0 /100 | #305 | Tragic 82.2% |
| Blacks/African Americans | 0.0 /100 | #306 | Tragic 82.2% |
| Hispanics or Latinos | 0.0 /100 | #307 | Tragic 82.1% |
| Immigrants | Central America | 0.0 /100 | #308 | Tragic 82.0% |
| Cree | 0.0 /100 | #309 | Tragic 82.0% |
| Blackfeet | 0.0 /100 | #310 | Tragic 81.9% |
| Colville | 0.0 /100 | #311 | Tragic 81.7% |
| Alaska Natives | 0.0 /100 | #312 | Tragic 81.6% |
| Mexicans | 0.0 /100 | #313 | Tragic 81.6% |
| Cajuns | 0.0 /100 | #314 | Tragic 81.5% |
| Immigrants | Mexico | 0.0 /100 | #315 | Tragic 81.5% |
| Comanche | 0.0 /100 | #316 | Tragic 81.5% |
| Cherokee | 0.0 /100 | #317 | Tragic 81.4% |
| Alaskan Athabascans | 0.0 /100 | #318 | Tragic 81.3% |
| Inupiat | 0.0 /100 | #319 | Tragic 80.9% |
Demographics Similar to Immigrants from Honduras by In Labor Force | Age 35-44
In terms of in labor force | age 35-44, the demographic groups most similar to Immigrants from Honduras are French American Indian (83.2%, a difference of 0.0%), Immigrants from Fiji (83.2%, a difference of 0.020%), Spanish (83.2%, a difference of 0.020%), Nonimmigrants (83.2%, a difference of 0.040%), and Hawaiian (83.2%, a difference of 0.060%).
| Demographics | Rating | Rank | In Labor Force | Age 35-44 |
| Iroquois | 0.2 /100 | #263 | Tragic 83.5% |
| Scotch-Irish | 0.1 /100 | #264 | Tragic 83.5% |
| Central Americans | 0.1 /100 | #265 | Tragic 83.5% |
| Spaniards | 0.1 /100 | #266 | Tragic 83.4% |
| Guamanians/Chamorros | 0.1 /100 | #267 | Tragic 83.4% |
| Hondurans | 0.1 /100 | #268 | Tragic 83.4% |
| Immigrants | Grenada | 0.1 /100 | #269 | Tragic 83.3% |
| Immigrants | Honduras | 0.0 /100 | #270 | Tragic 83.3% |
| French American Indians | 0.0 /100 | #271 | Tragic 83.2% |
| Immigrants | Fiji | 0.0 /100 | #272 | Tragic 83.2% |
| Spanish | 0.0 /100 | #273 | Tragic 83.2% |
| Immigrants | Nonimmigrants | 0.0 /100 | #274 | Tragic 83.2% |
| Hawaiians | 0.0 /100 | #275 | Tragic 83.2% |
| Delaware | 0.0 /100 | #276 | Tragic 83.2% |
| Samoans | 0.0 /100 | #277 | Tragic 83.2% |