African vs Marshallese In Labor Force | Age 20-64
COMPARE
African
Marshallese
In Labor Force | Age 20-64
In Labor Force | Age 20-64 Comparison
Africans
Marshallese
77.9%
IN LABOR FORCE | AGE 20-64
0.0/ 100
METRIC RATING
289th/ 347
METRIC RANK
78.3%
IN LABOR FORCE | AGE 20-64
0.0/ 100
METRIC RATING
272nd/ 347
METRIC RANK
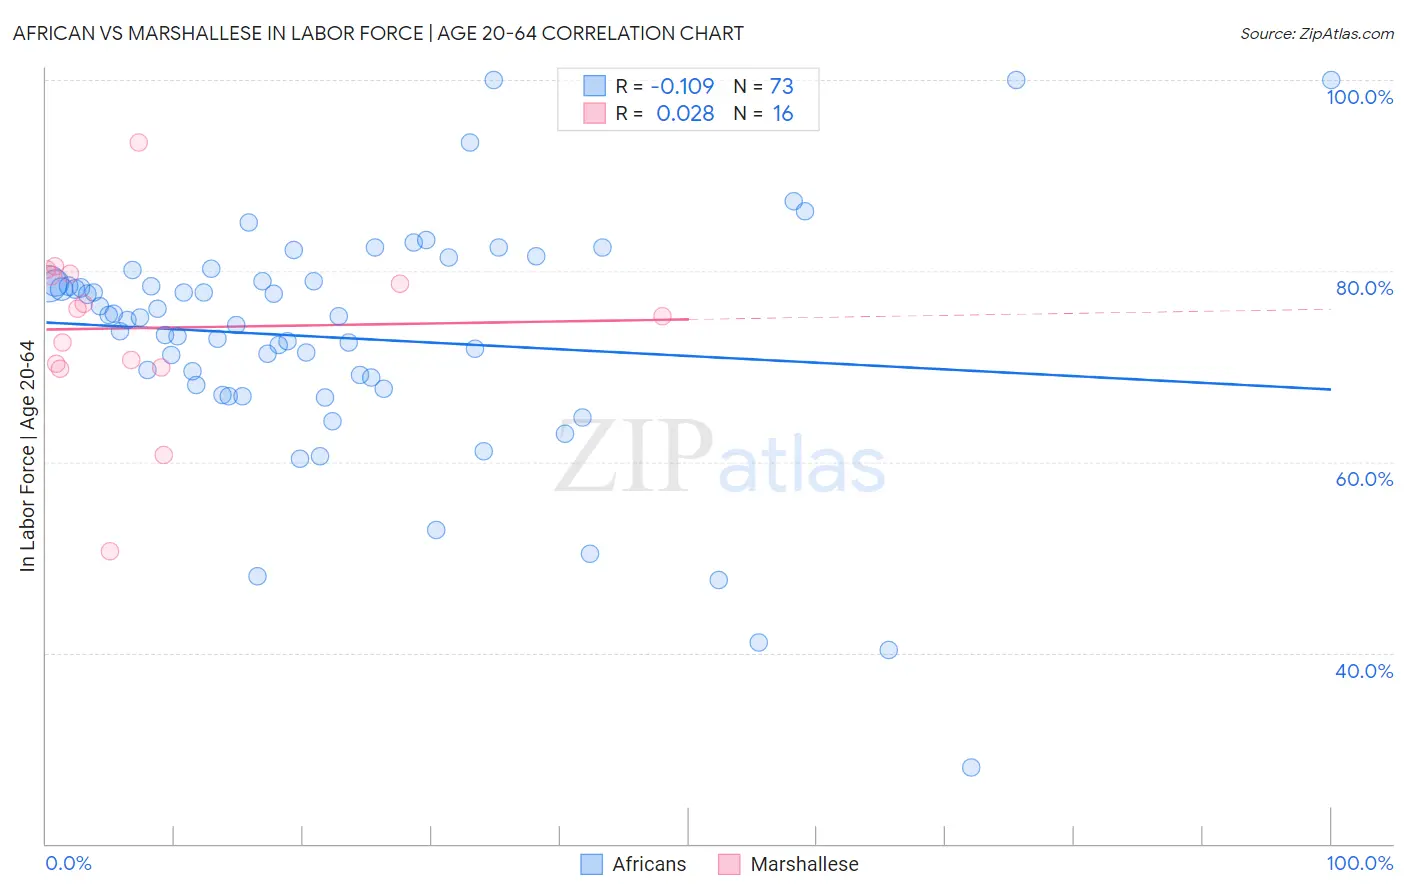
African vs Marshallese In Labor Force | Age 20-64 Correlation Chart
The statistical analysis conducted on geographies consisting of 470,088,010 people shows a poor negative correlation between the proportion of Africans and labor force participation rate among population between the ages 20 and 64 in the United States with a correlation coefficient (R) of -0.109 and weighted average of 77.9%. Similarly, the statistical analysis conducted on geographies consisting of 14,761,315 people shows no correlation between the proportion of Marshallese and labor force participation rate among population between the ages 20 and 64 in the United States with a correlation coefficient (R) of 0.028 and weighted average of 78.3%, a difference of 0.46%.
In Labor Force | Age 20-64 Correlation Summary
| Measurement | African | Marshallese |
| Minimum | 28.0% | 50.6% |
| Maximum | 100.0% | 93.5% |
| Range | 72.0% | 42.9% |
| Mean | 73.0% | 74.0% |
| Median | 75.1% | 75.7% |
| Interquartile 25% (IQ1) | 67.9% | 70.1% |
| Interquartile 75% (IQ3) | 79.0% | 79.6% |
| Interquartile Range (IQR) | 11.1% | 9.5% |
| Standard Deviation (Sample) | 12.7% | 9.5% |
| Standard Deviation (Population) | 12.6% | 9.2% |
Demographics Similar to Africans and Marshallese by In Labor Force | Age 20-64
In terms of in labor force | age 20-64, the demographic groups most similar to Africans are Hmong (77.9%, a difference of 0.010%), Immigrants from Bangladesh (77.9%, a difference of 0.010%), Vietnamese (78.0%, a difference of 0.080%), Immigrants from Belize (78.0%, a difference of 0.090%), and Osage (78.0%, a difference of 0.10%). Similarly, the demographic groups most similar to Marshallese are Immigrants from Latin America (78.3%, a difference of 0.0%), Scotch-Irish (78.3%, a difference of 0.020%), French American Indian (78.2%, a difference of 0.040%), Aleut (78.2%, a difference of 0.070%), and Spanish (78.2%, a difference of 0.070%).
| Demographics | Rating | Rank | In Labor Force | Age 20-64 |
| Scotch-Irish | 0.0 /100 | #270 | Tragic 78.3% |
| Immigrants | Latin America | 0.0 /100 | #271 | Tragic 78.3% |
| Marshallese | 0.0 /100 | #272 | Tragic 78.3% |
| French American Indians | 0.0 /100 | #273 | Tragic 78.2% |
| Aleuts | 0.0 /100 | #274 | Tragic 78.2% |
| Spanish | 0.0 /100 | #275 | Tragic 78.2% |
| Puget Sound Salish | 0.0 /100 | #276 | Tragic 78.2% |
| Immigrants | Bahamas | 0.0 /100 | #277 | Tragic 78.2% |
| Mexican American Indians | 0.0 /100 | #278 | Tragic 78.2% |
| Belizeans | 0.0 /100 | #279 | Tragic 78.2% |
| Immigrants | Dominica | 0.0 /100 | #280 | Tragic 78.1% |
| Guyanese | 0.0 /100 | #281 | Tragic 78.1% |
| Immigrants | St. Vincent and the Grenadines | 0.0 /100 | #282 | Tragic 78.1% |
| Immigrants | Nonimmigrants | 0.0 /100 | #283 | Tragic 78.1% |
| Immigrants | Guyana | 0.0 /100 | #284 | Tragic 78.1% |
| Osage | 0.0 /100 | #285 | Tragic 78.0% |
| Immigrants | Belize | 0.0 /100 | #286 | Tragic 78.0% |
| Vietnamese | 0.0 /100 | #287 | Tragic 78.0% |
| Hmong | 0.0 /100 | #288 | Tragic 77.9% |
| Africans | 0.0 /100 | #289 | Tragic 77.9% |
| Immigrants | Bangladesh | 0.0 /100 | #290 | Tragic 77.9% |