African vs Immigrants from Ecuador In Labor Force | Age 20-64
COMPARE
African
Immigrants from Ecuador
In Labor Force | Age 20-64
In Labor Force | Age 20-64 Comparison
Africans
Immigrants from Ecuador
77.9%
IN LABOR FORCE | AGE 20-64
0.0/ 100
METRIC RATING
289th/ 347
METRIC RANK
79.3%
IN LABOR FORCE | AGE 20-64
16.9/ 100
METRIC RATING
206th/ 347
METRIC RANK
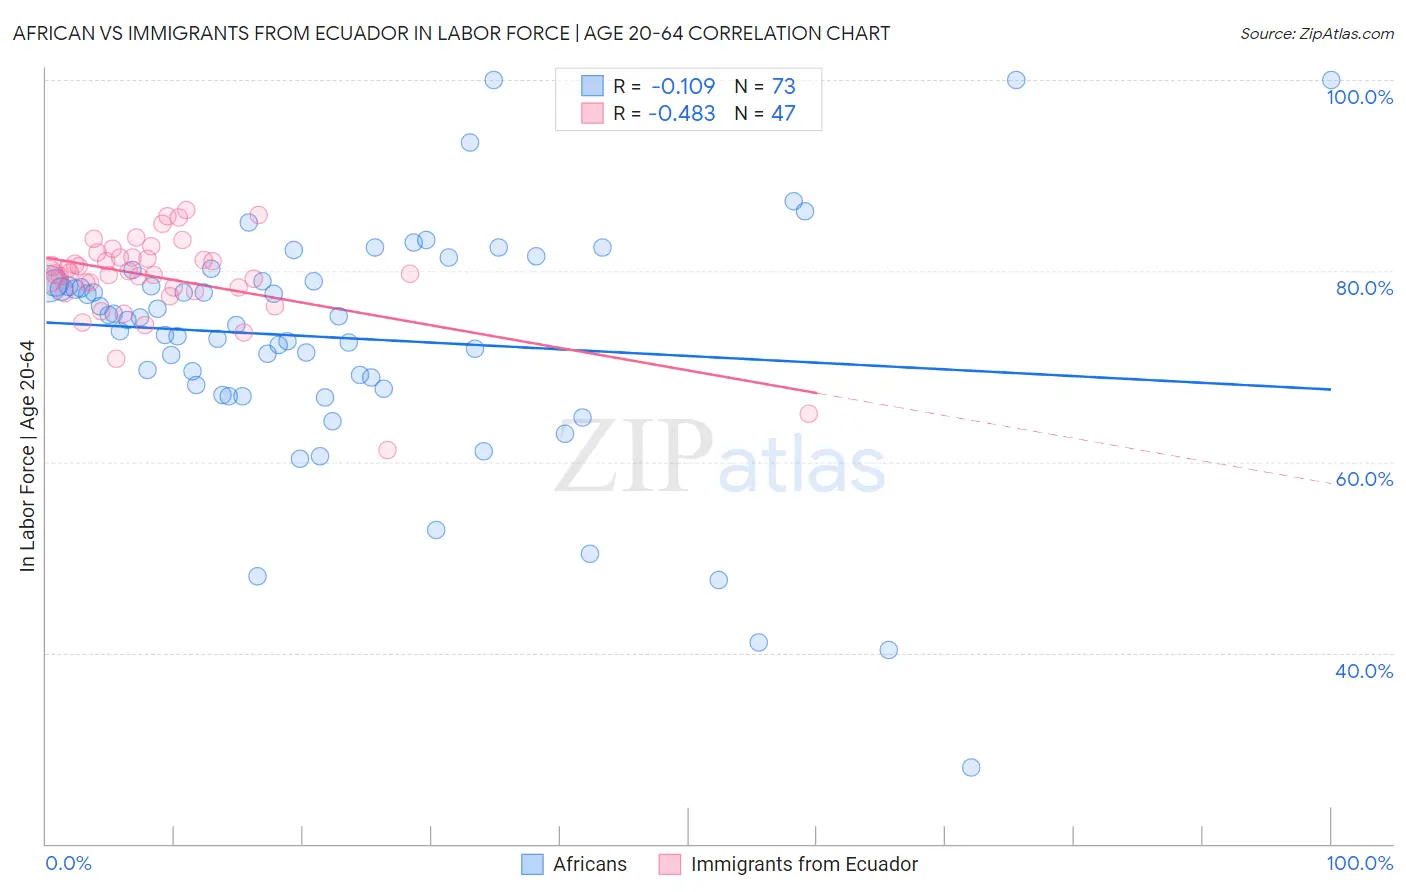
African vs Immigrants from Ecuador In Labor Force | Age 20-64 Correlation Chart
The statistical analysis conducted on geographies consisting of 470,088,010 people shows a poor negative correlation between the proportion of Africans and labor force participation rate among population between the ages 20 and 64 in the United States with a correlation coefficient (R) of -0.109 and weighted average of 77.9%. Similarly, the statistical analysis conducted on geographies consisting of 271,016,720 people shows a moderate negative correlation between the proportion of Immigrants from Ecuador and labor force participation rate among population between the ages 20 and 64 in the United States with a correlation coefficient (R) of -0.483 and weighted average of 79.3%, a difference of 1.8%.
In Labor Force | Age 20-64 Correlation Summary
| Measurement | African | Immigrants from Ecuador |
| Minimum | 28.0% | 61.3% |
| Maximum | 100.0% | 86.4% |
| Range | 72.0% | 25.1% |
| Mean | 73.0% | 79.3% |
| Median | 75.1% | 79.7% |
| Interquartile 25% (IQ1) | 67.9% | 77.9% |
| Interquartile 75% (IQ3) | 79.0% | 81.4% |
| Interquartile Range (IQR) | 11.1% | 3.5% |
| Standard Deviation (Sample) | 12.7% | 4.8% |
| Standard Deviation (Population) | 12.6% | 4.7% |
Similar Demographics by In Labor Force | Age 20-64
Demographics Similar to Africans by In Labor Force | Age 20-64
In terms of in labor force | age 20-64, the demographic groups most similar to Africans are Hmong (77.9%, a difference of 0.010%), Immigrants from Bangladesh (77.9%, a difference of 0.010%), Spanish American (77.8%, a difference of 0.070%), Vietnamese (78.0%, a difference of 0.080%), and Immigrants from Belize (78.0%, a difference of 0.090%).
| Demographics | Rating | Rank | In Labor Force | Age 20-64 |
| Immigrants | St. Vincent and the Grenadines | 0.0 /100 | #282 | Tragic 78.1% |
| Immigrants | Nonimmigrants | 0.0 /100 | #283 | Tragic 78.1% |
| Immigrants | Guyana | 0.0 /100 | #284 | Tragic 78.1% |
| Osage | 0.0 /100 | #285 | Tragic 78.0% |
| Immigrants | Belize | 0.0 /100 | #286 | Tragic 78.0% |
| Vietnamese | 0.0 /100 | #287 | Tragic 78.0% |
| Hmong | 0.0 /100 | #288 | Tragic 77.9% |
| Africans | 0.0 /100 | #289 | Tragic 77.9% |
| Immigrants | Bangladesh | 0.0 /100 | #290 | Tragic 77.9% |
| Spanish Americans | 0.0 /100 | #291 | Tragic 77.8% |
| Immigrants | Azores | 0.0 /100 | #292 | Tragic 77.8% |
| Delaware | 0.0 /100 | #293 | Tragic 77.8% |
| Immigrants | Central America | 0.0 /100 | #294 | Tragic 77.7% |
| Immigrants | Grenada | 0.0 /100 | #295 | Tragic 77.7% |
| Immigrants | Dominican Republic | 0.0 /100 | #296 | Tragic 77.7% |
Demographics Similar to Immigrants from Ecuador by In Labor Force | Age 20-64
In terms of in labor force | age 20-64, the demographic groups most similar to Immigrants from Ecuador are Subsaharan African (79.3%, a difference of 0.0%), Iraqi (79.3%, a difference of 0.010%), Immigrants from Cambodia (79.3%, a difference of 0.010%), Immigrants from Congo (79.3%, a difference of 0.010%), and British (79.3%, a difference of 0.010%).
| Demographics | Rating | Rank | In Labor Force | Age 20-64 |
| Dutch | 20.2 /100 | #199 | Fair 79.3% |
| Immigrants | Oceania | 19.1 /100 | #200 | Poor 79.3% |
| Immigrants | Nicaragua | 19.0 /100 | #201 | Poor 79.3% |
| Nicaraguans | 18.3 /100 | #202 | Poor 79.3% |
| Iraqis | 17.7 /100 | #203 | Poor 79.3% |
| Immigrants | Cambodia | 17.6 /100 | #204 | Poor 79.3% |
| Immigrants | Congo | 17.5 /100 | #205 | Poor 79.3% |
| Immigrants | Ecuador | 16.9 /100 | #206 | Poor 79.3% |
| Sub-Saharan Africans | 16.5 /100 | #207 | Poor 79.3% |
| British | 16.5 /100 | #208 | Poor 79.3% |
| Bangladeshis | 16.4 /100 | #209 | Poor 79.3% |
| Haitians | 16.1 /100 | #210 | Poor 79.3% |
| Europeans | 15.3 /100 | #211 | Poor 79.3% |
| Irish | 13.2 /100 | #212 | Poor 79.3% |
| Immigrants | Portugal | 12.8 /100 | #213 | Poor 79.3% |