Afghan vs Tongan In Labor Force | Age 20-24
COMPARE
Afghan
Tongan
In Labor Force | Age 20-24
In Labor Force | Age 20-24 Comparison
Afghans
Tongans
75.2%
IN LABOR FORCE | AGE 20-24
63.5/ 100
METRIC RATING
165th/ 347
METRIC RANK
77.9%
IN LABOR FORCE | AGE 20-24
100.0/ 100
METRIC RATING
26th/ 347
METRIC RANK
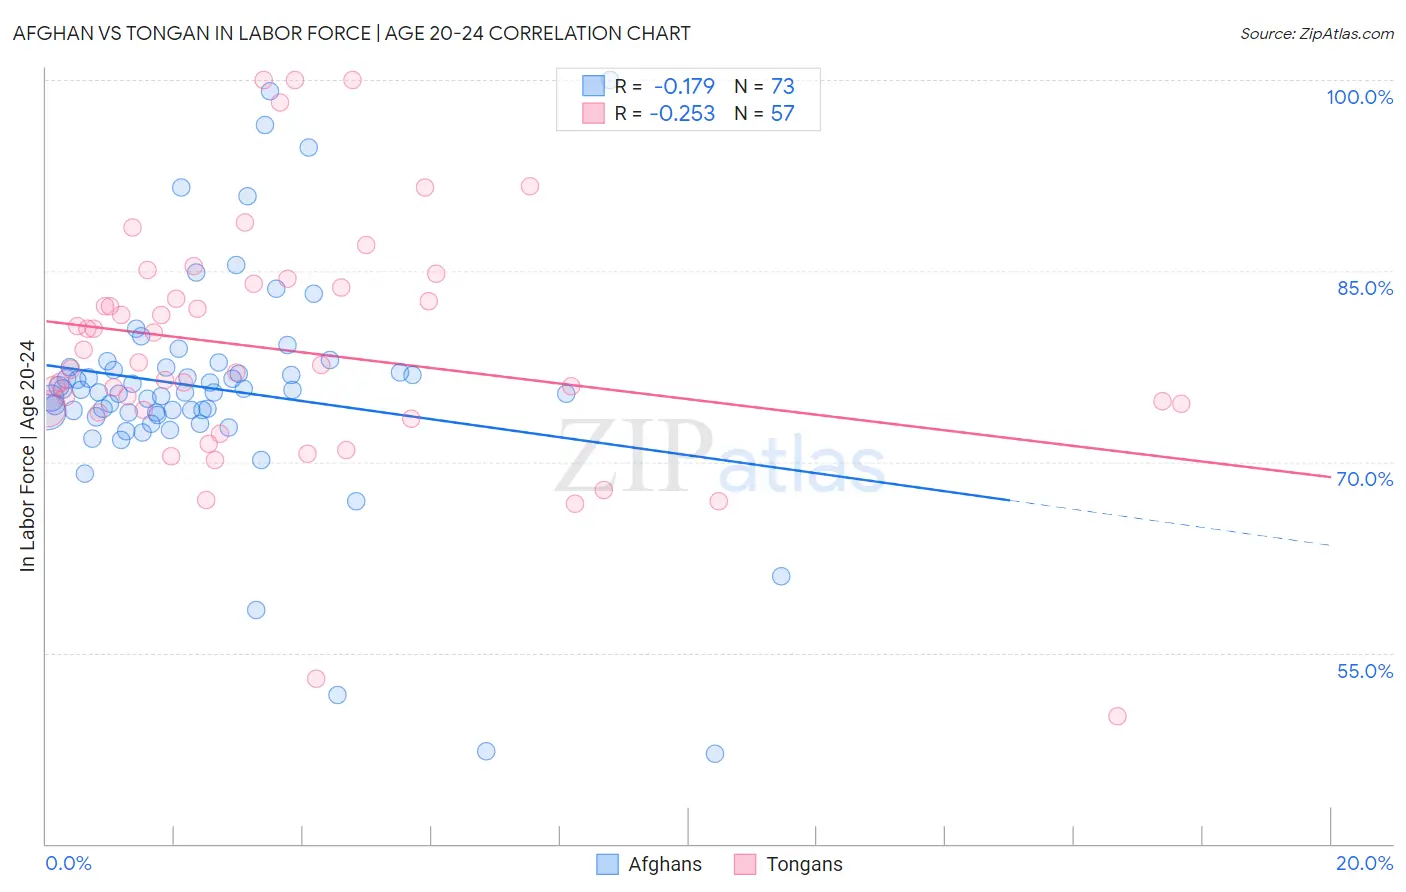
Afghan vs Tongan In Labor Force | Age 20-24 Correlation Chart
The statistical analysis conducted on geographies consisting of 148,869,972 people shows a poor negative correlation between the proportion of Afghans and labor force participation rate among population between the ages 20 and 24 in the United States with a correlation coefficient (R) of -0.179 and weighted average of 75.2%. Similarly, the statistical analysis conducted on geographies consisting of 102,904,168 people shows a weak negative correlation between the proportion of Tongans and labor force participation rate among population between the ages 20 and 24 in the United States with a correlation coefficient (R) of -0.253 and weighted average of 77.9%, a difference of 3.6%.
In Labor Force | Age 20-24 Correlation Summary
| Measurement | Afghan | Tongan |
| Minimum | 47.1% | 50.0% |
| Maximum | 100.0% | 100.0% |
| Range | 52.9% | 50.0% |
| Mean | 75.8% | 78.7% |
| Median | 75.5% | 77.6% |
| Interquartile 25% (IQ1) | 73.8% | 74.0% |
| Interquartile 75% (IQ3) | 77.4% | 83.8% |
| Interquartile Range (IQR) | 3.6% | 9.8% |
| Standard Deviation (Sample) | 9.0% | 9.7% |
| Standard Deviation (Population) | 8.9% | 9.6% |
Similar Demographics by In Labor Force | Age 20-24
Demographics Similar to Afghans by In Labor Force | Age 20-24
In terms of in labor force | age 20-24, the demographic groups most similar to Afghans are Costa Rican (75.2%, a difference of 0.010%), Bolivian (75.2%, a difference of 0.010%), Immigrants from Romania (75.2%, a difference of 0.020%), New Zealander (75.2%, a difference of 0.030%), and Cambodian (75.2%, a difference of 0.050%).
| Demographics | Rating | Rank | In Labor Force | Age 20-24 |
| Immigrants | Bolivia | 71.0 /100 | #158 | Good 75.3% |
| South American Indians | 69.0 /100 | #159 | Good 75.3% |
| Japanese | 68.7 /100 | #160 | Good 75.3% |
| New Zealanders | 65.4 /100 | #161 | Good 75.2% |
| Immigrants | Romania | 64.6 /100 | #162 | Good 75.2% |
| Costa Ricans | 64.2 /100 | #163 | Good 75.2% |
| Bolivians | 64.0 /100 | #164 | Good 75.2% |
| Afghans | 63.5 /100 | #165 | Good 75.2% |
| Cambodians | 60.5 /100 | #166 | Good 75.2% |
| Immigrants | South Eastern Asia | 57.5 /100 | #167 | Average 75.1% |
| Immigrants | Western Africa | 56.7 /100 | #168 | Average 75.1% |
| Immigrants | Philippines | 55.8 /100 | #169 | Average 75.1% |
| Mexicans | 52.1 /100 | #170 | Average 75.1% |
| Cajuns | 51.1 /100 | #171 | Average 75.1% |
| Yakama | 50.8 /100 | #172 | Average 75.1% |
Demographics Similar to Tongans by In Labor Force | Age 20-24
In terms of in labor force | age 20-24, the demographic groups most similar to Tongans are Tlingit-Haida (77.9%, a difference of 0.020%), Yugoslavian (78.0%, a difference of 0.060%), Liberian (78.0%, a difference of 0.060%), Pennsylvania German (78.0%, a difference of 0.070%), and Immigrants from Micronesia (77.8%, a difference of 0.12%).
| Demographics | Rating | Rank | In Labor Force | Age 20-24 |
| Bangladeshis | 100.0 /100 | #19 | Exceptional 78.1% |
| French Canadians | 100.0 /100 | #20 | Exceptional 78.1% |
| Puget Sound Salish | 100.0 /100 | #21 | Exceptional 78.0% |
| Pennsylvania Germans | 100.0 /100 | #22 | Exceptional 78.0% |
| Yugoslavians | 100.0 /100 | #23 | Exceptional 78.0% |
| Liberians | 100.0 /100 | #24 | Exceptional 78.0% |
| Tlingit-Haida | 100.0 /100 | #25 | Exceptional 77.9% |
| Tongans | 100.0 /100 | #26 | Exceptional 77.9% |
| Immigrants | Micronesia | 100.0 /100 | #27 | Exceptional 77.8% |
| Belgians | 100.0 /100 | #28 | Exceptional 77.8% |
| Slovaks | 100.0 /100 | #29 | Exceptional 77.7% |
| Swiss | 100.0 /100 | #30 | Exceptional 77.7% |
| Poles | 100.0 /100 | #31 | Exceptional 77.6% |
| English | 100.0 /100 | #32 | Exceptional 77.6% |
| Immigrants | Ethiopia | 100.0 /100 | #33 | Exceptional 77.5% |