Chippewa vs Tongan In Labor Force | Age 20-24
COMPARE
Chippewa
Tongan
In Labor Force | Age 20-24
In Labor Force | Age 20-24 Comparison
Chippewa
Tongans
77.1%
IN LABOR FORCE | AGE 20-24
99.9/ 100
METRIC RATING
57th/ 347
METRIC RANK
77.9%
IN LABOR FORCE | AGE 20-24
100.0/ 100
METRIC RATING
26th/ 347
METRIC RANK
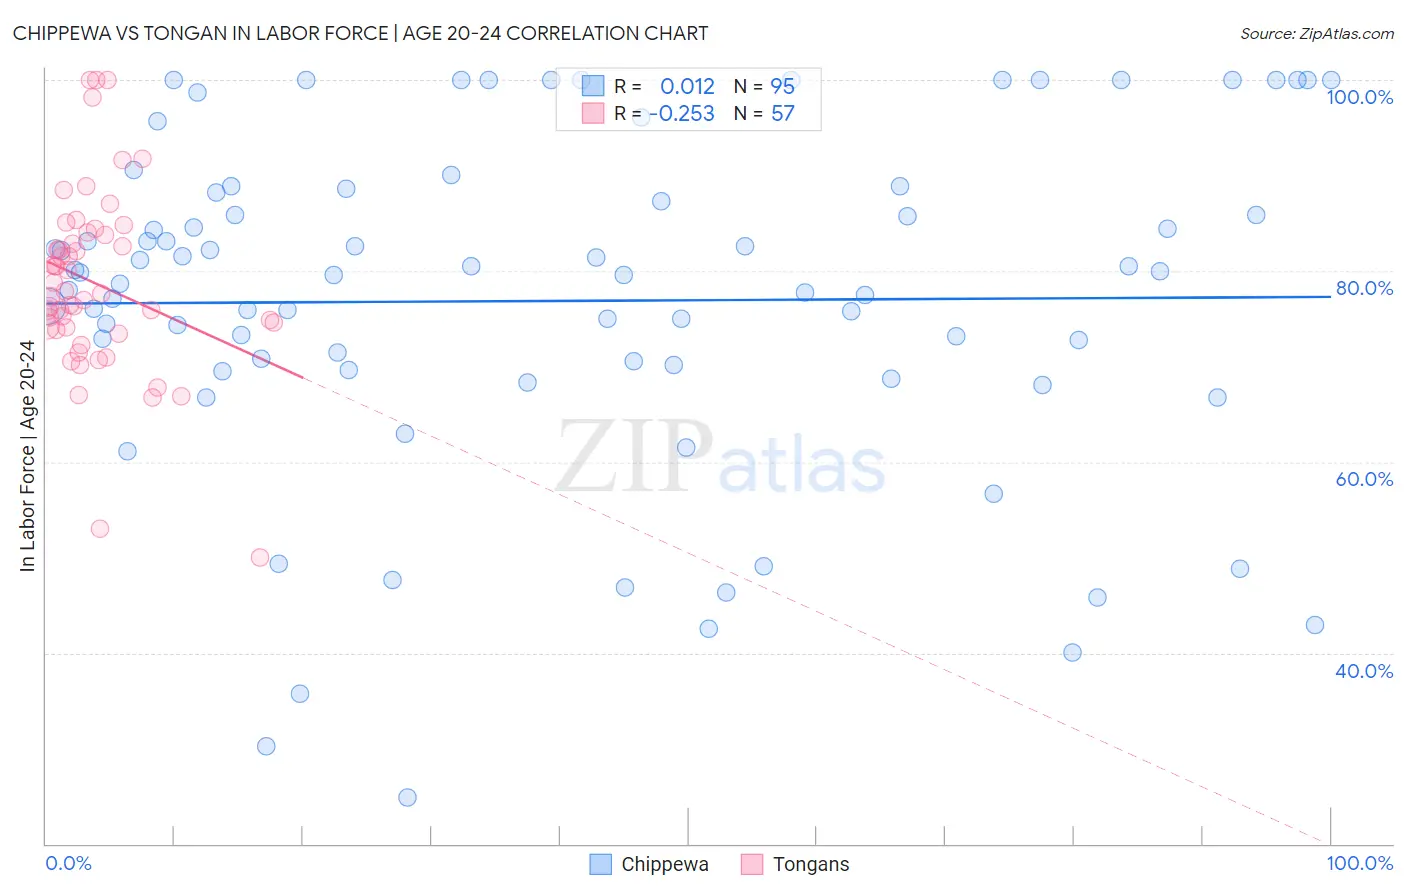
Chippewa vs Tongan In Labor Force | Age 20-24 Correlation Chart
The statistical analysis conducted on geographies consisting of 214,944,357 people shows no correlation between the proportion of Chippewa and labor force participation rate among population between the ages 20 and 24 in the United States with a correlation coefficient (R) of 0.012 and weighted average of 77.1%. Similarly, the statistical analysis conducted on geographies consisting of 102,904,168 people shows a weak negative correlation between the proportion of Tongans and labor force participation rate among population between the ages 20 and 24 in the United States with a correlation coefficient (R) of -0.253 and weighted average of 77.9%, a difference of 1.1%.
In Labor Force | Age 20-24 Correlation Summary
| Measurement | Chippewa | Tongan |
| Minimum | 24.8% | 50.0% |
| Maximum | 100.0% | 100.0% |
| Range | 75.2% | 50.0% |
| Mean | 76.9% | 78.7% |
| Median | 79.6% | 77.6% |
| Interquartile 25% (IQ1) | 69.6% | 74.0% |
| Interquartile 75% (IQ3) | 88.2% | 83.8% |
| Interquartile Range (IQR) | 18.6% | 9.8% |
| Standard Deviation (Sample) | 17.6% | 9.7% |
| Standard Deviation (Population) | 17.5% | 9.6% |
Similar Demographics by In Labor Force | Age 20-24
Demographics Similar to Chippewa by In Labor Force | Age 20-24
In terms of in labor force | age 20-24, the demographic groups most similar to Chippewa are Immigrants from Liberia (77.1%, a difference of 0.020%), European (77.1%, a difference of 0.020%), Hawaiian (77.0%, a difference of 0.020%), Celtic (77.1%, a difference of 0.040%), and Scotch-Irish (77.0%, a difference of 0.050%).
| Demographics | Rating | Rank | In Labor Force | Age 20-24 |
| Malaysians | 100.0 /100 | #50 | Exceptional 77.2% |
| Croatians | 100.0 /100 | #51 | Exceptional 77.2% |
| Indonesians | 100.0 /100 | #52 | Exceptional 77.2% |
| Immigrants | Azores | 100.0 /100 | #53 | Exceptional 77.2% |
| Celtics | 99.9 /100 | #54 | Exceptional 77.1% |
| Immigrants | Liberia | 99.9 /100 | #55 | Exceptional 77.1% |
| Europeans | 99.9 /100 | #56 | Exceptional 77.1% |
| Chippewa | 99.9 /100 | #57 | Exceptional 77.1% |
| Hawaiians | 99.9 /100 | #58 | Exceptional 77.0% |
| Scotch-Irish | 99.9 /100 | #59 | Exceptional 77.0% |
| Kenyans | 99.9 /100 | #60 | Exceptional 77.0% |
| Immigrants | Eritrea | 99.9 /100 | #61 | Exceptional 77.0% |
| Immigrants | Kenya | 99.9 /100 | #62 | Exceptional 77.0% |
| Lithuanians | 99.9 /100 | #63 | Exceptional 77.0% |
| Whites/Caucasians | 99.9 /100 | #64 | Exceptional 76.9% |
Demographics Similar to Tongans by In Labor Force | Age 20-24
In terms of in labor force | age 20-24, the demographic groups most similar to Tongans are Tlingit-Haida (77.9%, a difference of 0.020%), Yugoslavian (78.0%, a difference of 0.060%), Liberian (78.0%, a difference of 0.060%), Pennsylvania German (78.0%, a difference of 0.070%), and Immigrants from Micronesia (77.8%, a difference of 0.12%).
| Demographics | Rating | Rank | In Labor Force | Age 20-24 |
| Bangladeshis | 100.0 /100 | #19 | Exceptional 78.1% |
| French Canadians | 100.0 /100 | #20 | Exceptional 78.1% |
| Puget Sound Salish | 100.0 /100 | #21 | Exceptional 78.0% |
| Pennsylvania Germans | 100.0 /100 | #22 | Exceptional 78.0% |
| Yugoslavians | 100.0 /100 | #23 | Exceptional 78.0% |
| Liberians | 100.0 /100 | #24 | Exceptional 78.0% |
| Tlingit-Haida | 100.0 /100 | #25 | Exceptional 77.9% |
| Tongans | 100.0 /100 | #26 | Exceptional 77.9% |
| Immigrants | Micronesia | 100.0 /100 | #27 | Exceptional 77.8% |
| Belgians | 100.0 /100 | #28 | Exceptional 77.8% |
| Slovaks | 100.0 /100 | #29 | Exceptional 77.7% |
| Swiss | 100.0 /100 | #30 | Exceptional 77.7% |
| Poles | 100.0 /100 | #31 | Exceptional 77.6% |
| English | 100.0 /100 | #32 | Exceptional 77.6% |
| Immigrants | Ethiopia | 100.0 /100 | #33 | Exceptional 77.5% |