Afghan vs Immigrants In Labor Force | Age 20-24
COMPARE
Afghan
Immigrants
In Labor Force | Age 20-24
In Labor Force | Age 20-24 Comparison
Afghans
Immigrants
75.2%
IN LABOR FORCE | AGE 20-24
63.5/ 100
METRIC RATING
165th/ 347
METRIC RANK
74.1%
IN LABOR FORCE | AGE 20-24
3.6/ 100
METRIC RATING
234th/ 347
METRIC RANK
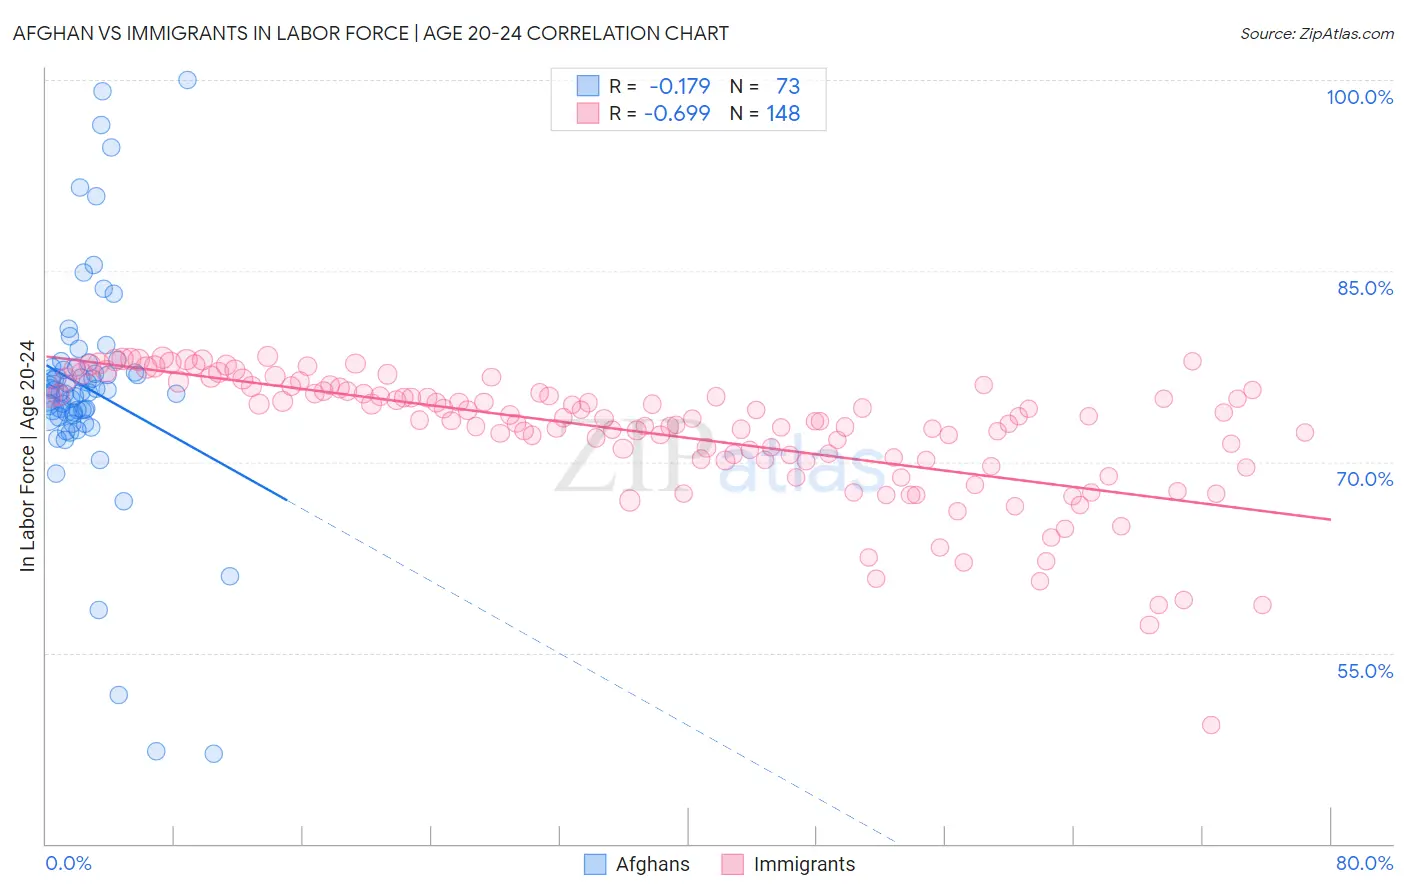
Afghan vs Immigrants In Labor Force | Age 20-24 Correlation Chart
The statistical analysis conducted on geographies consisting of 148,869,972 people shows a poor negative correlation between the proportion of Afghans and labor force participation rate among population between the ages 20 and 24 in the United States with a correlation coefficient (R) of -0.179 and weighted average of 75.2%. Similarly, the statistical analysis conducted on geographies consisting of 576,110,803 people shows a significant negative correlation between the proportion of Immigrants and labor force participation rate among population between the ages 20 and 24 in the United States with a correlation coefficient (R) of -0.699 and weighted average of 74.1%, a difference of 1.4%.
In Labor Force | Age 20-24 Correlation Summary
| Measurement | Afghan | Immigrants |
| Minimum | 47.1% | 49.3% |
| Maximum | 100.0% | 78.3% |
| Range | 52.9% | 29.0% |
| Mean | 75.8% | 72.3% |
| Median | 75.5% | 73.4% |
| Interquartile 25% (IQ1) | 73.8% | 70.2% |
| Interquartile 75% (IQ3) | 77.4% | 75.6% |
| Interquartile Range (IQR) | 3.6% | 5.4% |
| Standard Deviation (Sample) | 9.0% | 5.0% |
| Standard Deviation (Population) | 8.9% | 5.0% |
Similar Demographics by In Labor Force | Age 20-24
Demographics Similar to Afghans by In Labor Force | Age 20-24
In terms of in labor force | age 20-24, the demographic groups most similar to Afghans are Costa Rican (75.2%, a difference of 0.010%), Bolivian (75.2%, a difference of 0.010%), Immigrants from Romania (75.2%, a difference of 0.020%), New Zealander (75.2%, a difference of 0.030%), and Cambodian (75.2%, a difference of 0.050%).
| Demographics | Rating | Rank | In Labor Force | Age 20-24 |
| Immigrants | Bolivia | 71.0 /100 | #158 | Good 75.3% |
| South American Indians | 69.0 /100 | #159 | Good 75.3% |
| Japanese | 68.7 /100 | #160 | Good 75.3% |
| New Zealanders | 65.4 /100 | #161 | Good 75.2% |
| Immigrants | Romania | 64.6 /100 | #162 | Good 75.2% |
| Costa Ricans | 64.2 /100 | #163 | Good 75.2% |
| Bolivians | 64.0 /100 | #164 | Good 75.2% |
| Afghans | 63.5 /100 | #165 | Good 75.2% |
| Cambodians | 60.5 /100 | #166 | Good 75.2% |
| Immigrants | South Eastern Asia | 57.5 /100 | #167 | Average 75.1% |
| Immigrants | Western Africa | 56.7 /100 | #168 | Average 75.1% |
| Immigrants | Philippines | 55.8 /100 | #169 | Average 75.1% |
| Mexicans | 52.1 /100 | #170 | Average 75.1% |
| Cajuns | 51.1 /100 | #171 | Average 75.1% |
| Yakama | 50.8 /100 | #172 | Average 75.1% |
Demographics Similar to Immigrants by In Labor Force | Age 20-24
In terms of in labor force | age 20-24, the demographic groups most similar to Immigrants are Immigrants from Chile (74.1%, a difference of 0.010%), Laotian (74.1%, a difference of 0.010%), Immigrants from France (74.1%, a difference of 0.030%), Bermudan (74.1%, a difference of 0.040%), and Immigrants from Switzerland (74.2%, a difference of 0.050%).
| Demographics | Rating | Rank | In Labor Force | Age 20-24 |
| Immigrants | Ireland | 5.8 /100 | #227 | Tragic 74.3% |
| Immigrants | Ukraine | 5.1 /100 | #228 | Tragic 74.2% |
| Immigrants | Sweden | 4.6 /100 | #229 | Tragic 74.2% |
| Immigrants | Albania | 4.3 /100 | #230 | Tragic 74.2% |
| Immigrants | Greece | 4.1 /100 | #231 | Tragic 74.2% |
| Immigrants | Switzerland | 4.1 /100 | #232 | Tragic 74.2% |
| Immigrants | Chile | 3.7 /100 | #233 | Tragic 74.1% |
| Immigrants | Immigrants | 3.6 /100 | #234 | Tragic 74.1% |
| Laotians | 3.5 /100 | #235 | Tragic 74.1% |
| Immigrants | France | 3.3 /100 | #236 | Tragic 74.1% |
| Bermudans | 3.2 /100 | #237 | Tragic 74.1% |
| Immigrants | Japan | 3.0 /100 | #238 | Tragic 74.1% |
| Immigrants | Latin America | 2.7 /100 | #239 | Tragic 74.1% |
| Immigrants | Sri Lanka | 2.3 /100 | #240 | Tragic 74.0% |
| Immigrants | Senegal | 2.1 /100 | #241 | Tragic 74.0% |