Spaniard vs Tongan In Labor Force | Age 20-24
COMPARE
Spaniard
Tongan
In Labor Force | Age 20-24
In Labor Force | Age 20-24 Comparison
Spaniards
Tongans
75.5%
IN LABOR FORCE | AGE 20-24
82.0/ 100
METRIC RATING
143rd/ 347
METRIC RANK
77.9%
IN LABOR FORCE | AGE 20-24
100.0/ 100
METRIC RATING
26th/ 347
METRIC RANK
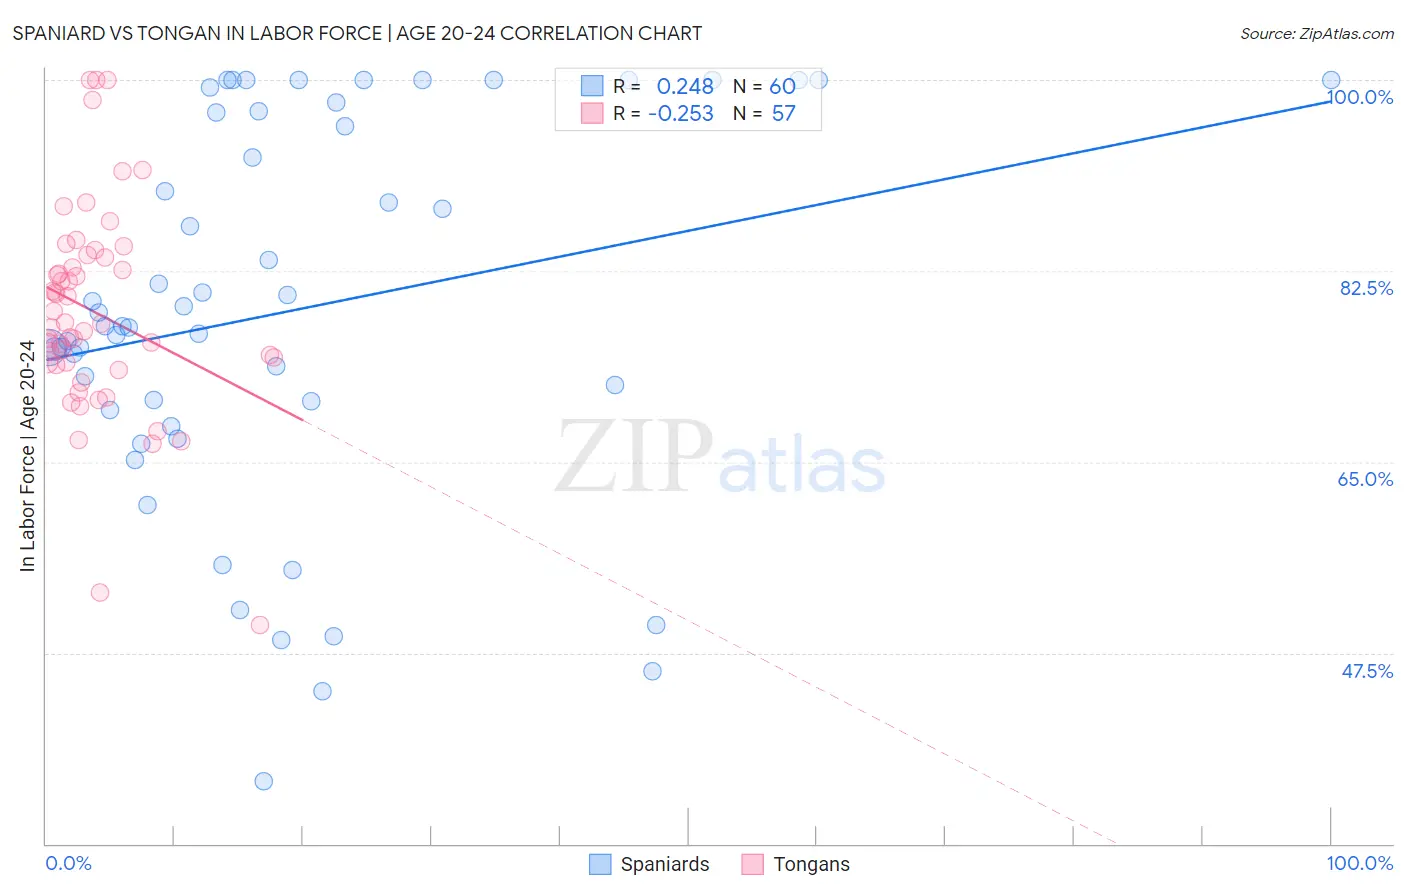
Spaniard vs Tongan In Labor Force | Age 20-24 Correlation Chart
The statistical analysis conducted on geographies consisting of 443,259,827 people shows a weak positive correlation between the proportion of Spaniards and labor force participation rate among population between the ages 20 and 24 in the United States with a correlation coefficient (R) of 0.248 and weighted average of 75.5%. Similarly, the statistical analysis conducted on geographies consisting of 102,904,168 people shows a weak negative correlation between the proportion of Tongans and labor force participation rate among population between the ages 20 and 24 in the United States with a correlation coefficient (R) of -0.253 and weighted average of 77.9%, a difference of 3.2%.
In Labor Force | Age 20-24 Correlation Summary
| Measurement | Spaniard | Tongan |
| Minimum | 35.7% | 50.0% |
| Maximum | 100.0% | 100.0% |
| Range | 64.3% | 50.0% |
| Mean | 78.8% | 78.7% |
| Median | 77.4% | 77.6% |
| Interquartile 25% (IQ1) | 70.2% | 74.0% |
| Interquartile 75% (IQ3) | 97.1% | 83.8% |
| Interquartile Range (IQR) | 26.9% | 9.8% |
| Standard Deviation (Sample) | 17.3% | 9.7% |
| Standard Deviation (Population) | 17.2% | 9.6% |
Similar Demographics by In Labor Force | Age 20-24
Demographics Similar to Spaniards by In Labor Force | Age 20-24
In terms of in labor force | age 20-24, the demographic groups most similar to Spaniards are Bhutanese (75.4%, a difference of 0.030%), Blackfeet (75.5%, a difference of 0.040%), Romanian (75.5%, a difference of 0.050%), Korean (75.4%, a difference of 0.050%), and Immigrants from Brazil (75.5%, a difference of 0.070%).
| Demographics | Rating | Rank | In Labor Force | Age 20-24 |
| Immigrants | Brazil | 84.8 /100 | #136 | Excellent 75.5% |
| Jordanians | 84.8 /100 | #137 | Excellent 75.5% |
| Australians | 84.8 /100 | #138 | Excellent 75.5% |
| Immigrants | England | 84.6 /100 | #139 | Excellent 75.5% |
| Delaware | 84.5 /100 | #140 | Excellent 75.5% |
| Romanians | 84.1 /100 | #141 | Excellent 75.5% |
| Blackfeet | 83.6 /100 | #142 | Excellent 75.5% |
| Spaniards | 82.0 /100 | #143 | Excellent 75.5% |
| Bhutanese | 80.8 /100 | #144 | Excellent 75.4% |
| Koreans | 79.7 /100 | #145 | Good 75.4% |
| Mexican American Indians | 78.8 /100 | #146 | Good 75.4% |
| Comanche | 77.6 /100 | #147 | Good 75.4% |
| Immigrants | Cambodia | 76.7 /100 | #148 | Good 75.4% |
| Ugandans | 76.1 /100 | #149 | Good 75.4% |
| Salvadorans | 74.8 /100 | #150 | Good 75.3% |
Demographics Similar to Tongans by In Labor Force | Age 20-24
In terms of in labor force | age 20-24, the demographic groups most similar to Tongans are Tlingit-Haida (77.9%, a difference of 0.020%), Yugoslavian (78.0%, a difference of 0.060%), Liberian (78.0%, a difference of 0.060%), Pennsylvania German (78.0%, a difference of 0.070%), and Immigrants from Micronesia (77.8%, a difference of 0.12%).
| Demographics | Rating | Rank | In Labor Force | Age 20-24 |
| Bangladeshis | 100.0 /100 | #19 | Exceptional 78.1% |
| French Canadians | 100.0 /100 | #20 | Exceptional 78.1% |
| Puget Sound Salish | 100.0 /100 | #21 | Exceptional 78.0% |
| Pennsylvania Germans | 100.0 /100 | #22 | Exceptional 78.0% |
| Yugoslavians | 100.0 /100 | #23 | Exceptional 78.0% |
| Liberians | 100.0 /100 | #24 | Exceptional 78.0% |
| Tlingit-Haida | 100.0 /100 | #25 | Exceptional 77.9% |
| Tongans | 100.0 /100 | #26 | Exceptional 77.9% |
| Immigrants | Micronesia | 100.0 /100 | #27 | Exceptional 77.8% |
| Belgians | 100.0 /100 | #28 | Exceptional 77.8% |
| Slovaks | 100.0 /100 | #29 | Exceptional 77.7% |
| Swiss | 100.0 /100 | #30 | Exceptional 77.7% |
| Poles | 100.0 /100 | #31 | Exceptional 77.6% |
| English | 100.0 /100 | #32 | Exceptional 77.6% |
| Immigrants | Ethiopia | 100.0 /100 | #33 | Exceptional 77.5% |