Afghan vs Immigrants from Central America In Labor Force | Age 20-24
COMPARE
Afghan
Immigrants from Central America
In Labor Force | Age 20-24
In Labor Force | Age 20-24 Comparison
Afghans
Immigrants from Central America
75.2%
IN LABOR FORCE | AGE 20-24
63.5/ 100
METRIC RATING
165th/ 347
METRIC RANK
75.0%
IN LABOR FORCE | AGE 20-24
45.0/ 100
METRIC RATING
178th/ 347
METRIC RANK
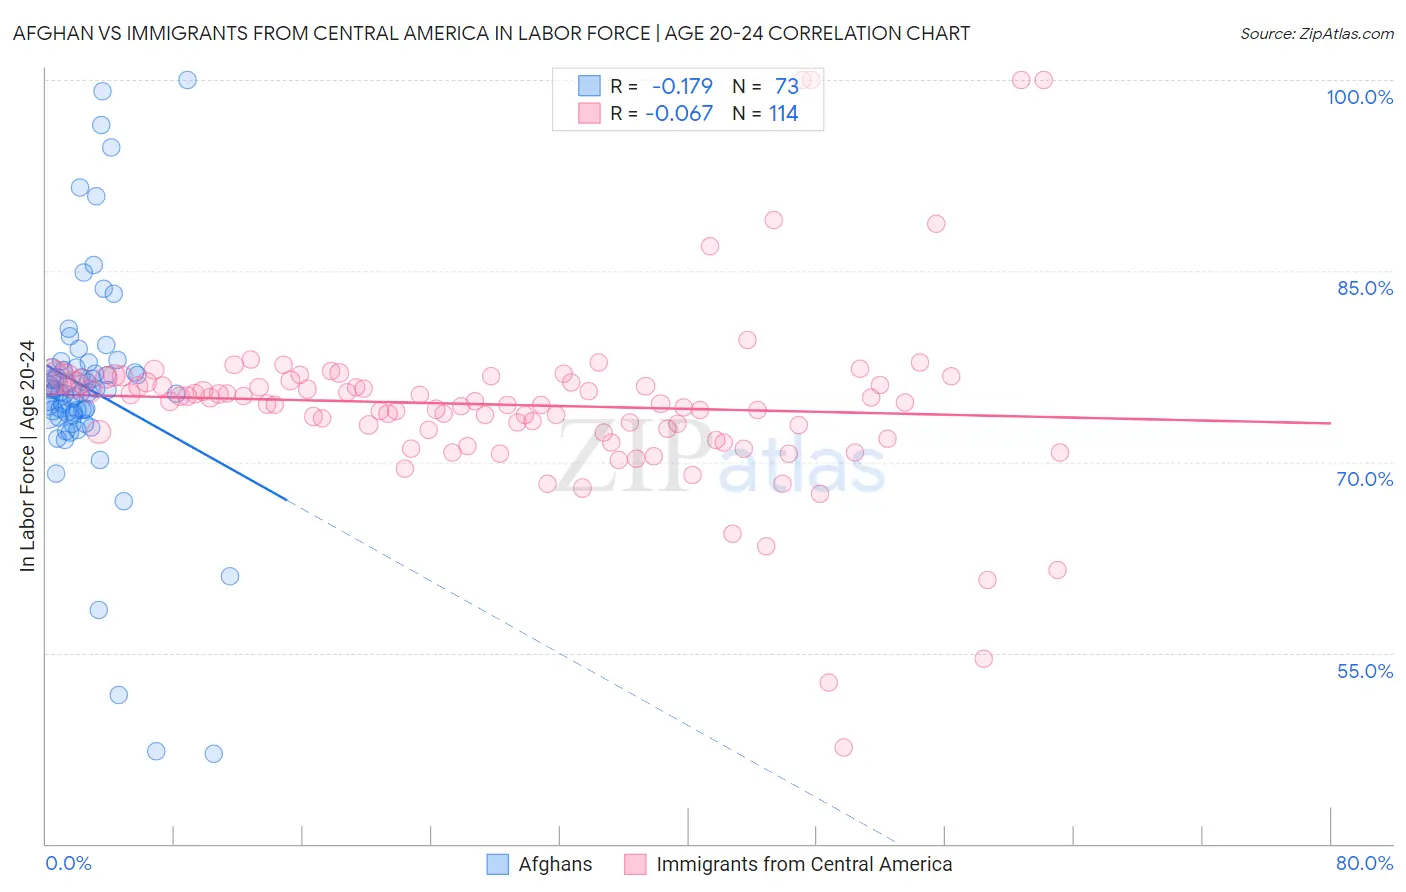
Afghan vs Immigrants from Central America In Labor Force | Age 20-24 Correlation Chart
The statistical analysis conducted on geographies consisting of 148,869,972 people shows a poor negative correlation between the proportion of Afghans and labor force participation rate among population between the ages 20 and 24 in the United States with a correlation coefficient (R) of -0.179 and weighted average of 75.2%. Similarly, the statistical analysis conducted on geographies consisting of 535,780,199 people shows a slight negative correlation between the proportion of Immigrants from Central America and labor force participation rate among population between the ages 20 and 24 in the United States with a correlation coefficient (R) of -0.067 and weighted average of 75.0%, a difference of 0.28%.
In Labor Force | Age 20-24 Correlation Summary
| Measurement | Afghan | Immigrants from Central America |
| Minimum | 47.1% | 47.5% |
| Maximum | 100.0% | 100.0% |
| Range | 52.9% | 52.5% |
| Mean | 75.8% | 74.5% |
| Median | 75.5% | 74.6% |
| Interquartile 25% (IQ1) | 73.8% | 72.4% |
| Interquartile 75% (IQ3) | 77.4% | 76.3% |
| Interquartile Range (IQR) | 3.6% | 4.0% |
| Standard Deviation (Sample) | 9.0% | 7.3% |
| Standard Deviation (Population) | 8.9% | 7.3% |
Demographics Similar to Afghans and Immigrants from Central America by In Labor Force | Age 20-24
In terms of in labor force | age 20-24, the demographic groups most similar to Afghans are Costa Rican (75.2%, a difference of 0.010%), Bolivian (75.2%, a difference of 0.010%), Immigrants from Romania (75.2%, a difference of 0.020%), New Zealander (75.2%, a difference of 0.030%), and Cambodian (75.2%, a difference of 0.050%). Similarly, the demographic groups most similar to Immigrants from Central America are Immigrants from Latvia (75.0%, a difference of 0.010%), Immigrants from Czechoslovakia (75.0%, a difference of 0.010%), Immigrants from Mexico (75.0%, a difference of 0.040%), African (75.0%, a difference of 0.040%), and Central American (75.0%, a difference of 0.050%).
| Demographics | Rating | Rank | In Labor Force | Age 20-24 |
| New Zealanders | 65.4 /100 | #161 | Good 75.2% |
| Immigrants | Romania | 64.6 /100 | #162 | Good 75.2% |
| Costa Ricans | 64.2 /100 | #163 | Good 75.2% |
| Bolivians | 64.0 /100 | #164 | Good 75.2% |
| Afghans | 63.5 /100 | #165 | Good 75.2% |
| Cambodians | 60.5 /100 | #166 | Good 75.2% |
| Immigrants | South Eastern Asia | 57.5 /100 | #167 | Average 75.1% |
| Immigrants | Western Africa | 56.7 /100 | #168 | Average 75.1% |
| Immigrants | Philippines | 55.8 /100 | #169 | Average 75.1% |
| Mexicans | 52.1 /100 | #170 | Average 75.1% |
| Cajuns | 51.1 /100 | #171 | Average 75.1% |
| Yakama | 50.8 /100 | #172 | Average 75.1% |
| Immigrants | Croatia | 50.2 /100 | #173 | Average 75.1% |
| South Africans | 50.0 /100 | #174 | Average 75.0% |
| Syrians | 49.5 /100 | #175 | Average 75.0% |
| Central Americans | 48.7 /100 | #176 | Average 75.0% |
| Immigrants | Mexico | 47.8 /100 | #177 | Average 75.0% |
| Immigrants | Central America | 45.0 /100 | #178 | Average 75.0% |
| Immigrants | Latvia | 44.1 /100 | #179 | Average 75.0% |
| Immigrants | Czechoslovakia | 44.0 /100 | #180 | Average 75.0% |
| Africans | 42.5 /100 | #181 | Average 75.0% |