Afghan vs Zimbabwean In Labor Force | Age 20-24
COMPARE
Afghan
Zimbabwean
In Labor Force | Age 20-24
In Labor Force | Age 20-24 Comparison
Afghans
Zimbabweans
75.2%
IN LABOR FORCE | AGE 20-24
63.5/ 100
METRIC RATING
165th/ 347
METRIC RANK
75.6%
IN LABOR FORCE | AGE 20-24
88.2/ 100
METRIC RATING
133rd/ 347
METRIC RANK
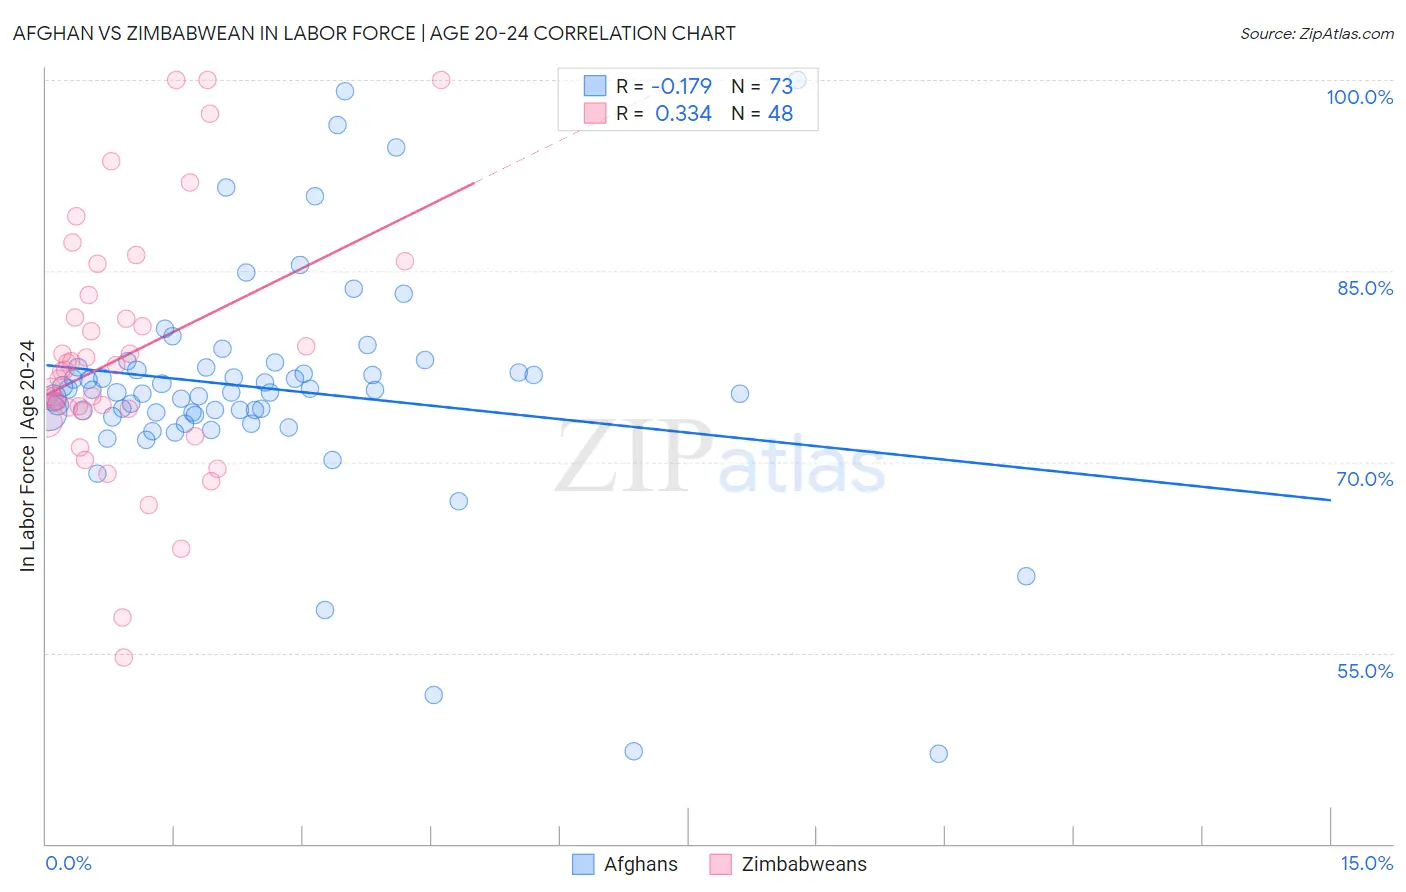
Afghan vs Zimbabwean In Labor Force | Age 20-24 Correlation Chart
The statistical analysis conducted on geographies consisting of 148,869,972 people shows a poor negative correlation between the proportion of Afghans and labor force participation rate among population between the ages 20 and 24 in the United States with a correlation coefficient (R) of -0.179 and weighted average of 75.2%. Similarly, the statistical analysis conducted on geographies consisting of 69,190,987 people shows a mild positive correlation between the proportion of Zimbabweans and labor force participation rate among population between the ages 20 and 24 in the United States with a correlation coefficient (R) of 0.334 and weighted average of 75.6%, a difference of 0.53%.
In Labor Force | Age 20-24 Correlation Summary
| Measurement | Afghan | Zimbabwean |
| Minimum | 47.1% | 54.6% |
| Maximum | 100.0% | 100.0% |
| Range | 52.9% | 45.4% |
| Mean | 75.8% | 78.3% |
| Median | 75.5% | 77.2% |
| Interquartile 25% (IQ1) | 73.8% | 74.1% |
| Interquartile 75% (IQ3) | 77.4% | 82.2% |
| Interquartile Range (IQR) | 3.6% | 8.1% |
| Standard Deviation (Sample) | 9.0% | 9.8% |
| Standard Deviation (Population) | 8.9% | 9.7% |
Similar Demographics by In Labor Force | Age 20-24
Demographics Similar to Afghans by In Labor Force | Age 20-24
In terms of in labor force | age 20-24, the demographic groups most similar to Afghans are Costa Rican (75.2%, a difference of 0.010%), Bolivian (75.2%, a difference of 0.010%), Immigrants from Romania (75.2%, a difference of 0.020%), New Zealander (75.2%, a difference of 0.030%), and Cambodian (75.2%, a difference of 0.050%).
| Demographics | Rating | Rank | In Labor Force | Age 20-24 |
| Immigrants | Bolivia | 71.0 /100 | #158 | Good 75.3% |
| South American Indians | 69.0 /100 | #159 | Good 75.3% |
| Japanese | 68.7 /100 | #160 | Good 75.3% |
| New Zealanders | 65.4 /100 | #161 | Good 75.2% |
| Immigrants | Romania | 64.6 /100 | #162 | Good 75.2% |
| Costa Ricans | 64.2 /100 | #163 | Good 75.2% |
| Bolivians | 64.0 /100 | #164 | Good 75.2% |
| Afghans | 63.5 /100 | #165 | Good 75.2% |
| Cambodians | 60.5 /100 | #166 | Good 75.2% |
| Immigrants | South Eastern Asia | 57.5 /100 | #167 | Average 75.1% |
| Immigrants | Western Africa | 56.7 /100 | #168 | Average 75.1% |
| Immigrants | Philippines | 55.8 /100 | #169 | Average 75.1% |
| Mexicans | 52.1 /100 | #170 | Average 75.1% |
| Cajuns | 51.1 /100 | #171 | Average 75.1% |
| Yakama | 50.8 /100 | #172 | Average 75.1% |
Demographics Similar to Zimbabweans by In Labor Force | Age 20-24
In terms of in labor force | age 20-24, the demographic groups most similar to Zimbabweans are Immigrants from Jordan (75.6%, a difference of 0.010%), Palestinian (75.6%, a difference of 0.010%), Immigrants from Austria (75.6%, a difference of 0.020%), Iroquois (75.6%, a difference of 0.030%), and Immigrants from Afghanistan (75.6%, a difference of 0.040%).
| Demographics | Rating | Rank | In Labor Force | Age 20-24 |
| Brazilians | 93.0 /100 | #126 | Exceptional 75.8% |
| Sub-Saharan Africans | 90.9 /100 | #127 | Exceptional 75.7% |
| Immigrants | Afghanistan | 89.4 /100 | #128 | Excellent 75.6% |
| Iroquois | 89.1 /100 | #129 | Excellent 75.6% |
| Immigrants | Austria | 88.8 /100 | #130 | Excellent 75.6% |
| Immigrants | Jordan | 88.5 /100 | #131 | Excellent 75.6% |
| Palestinians | 88.4 /100 | #132 | Excellent 75.6% |
| Zimbabweans | 88.2 /100 | #133 | Excellent 75.6% |
| Estonians | 87.1 /100 | #134 | Excellent 75.6% |
| Yaqui | 85.5 /100 | #135 | Excellent 75.5% |
| Immigrants | Brazil | 84.8 /100 | #136 | Excellent 75.5% |
| Jordanians | 84.8 /100 | #137 | Excellent 75.5% |
| Australians | 84.8 /100 | #138 | Excellent 75.5% |
| Immigrants | England | 84.6 /100 | #139 | Excellent 75.5% |
| Delaware | 84.5 /100 | #140 | Excellent 75.5% |