Afghan vs Tongan In Labor Force | Age 45-54
COMPARE
Afghan
Tongan
In Labor Force | Age 45-54
In Labor Force | Age 45-54 Comparison
Afghans
Tongans
83.5%
IN LABOR FORCE | AGE 45-54
97.9/ 100
METRIC RATING
63rd/ 347
METRIC RANK
83.1%
IN LABOR FORCE | AGE 45-54
88.2/ 100
METRIC RATING
123rd/ 347
METRIC RANK
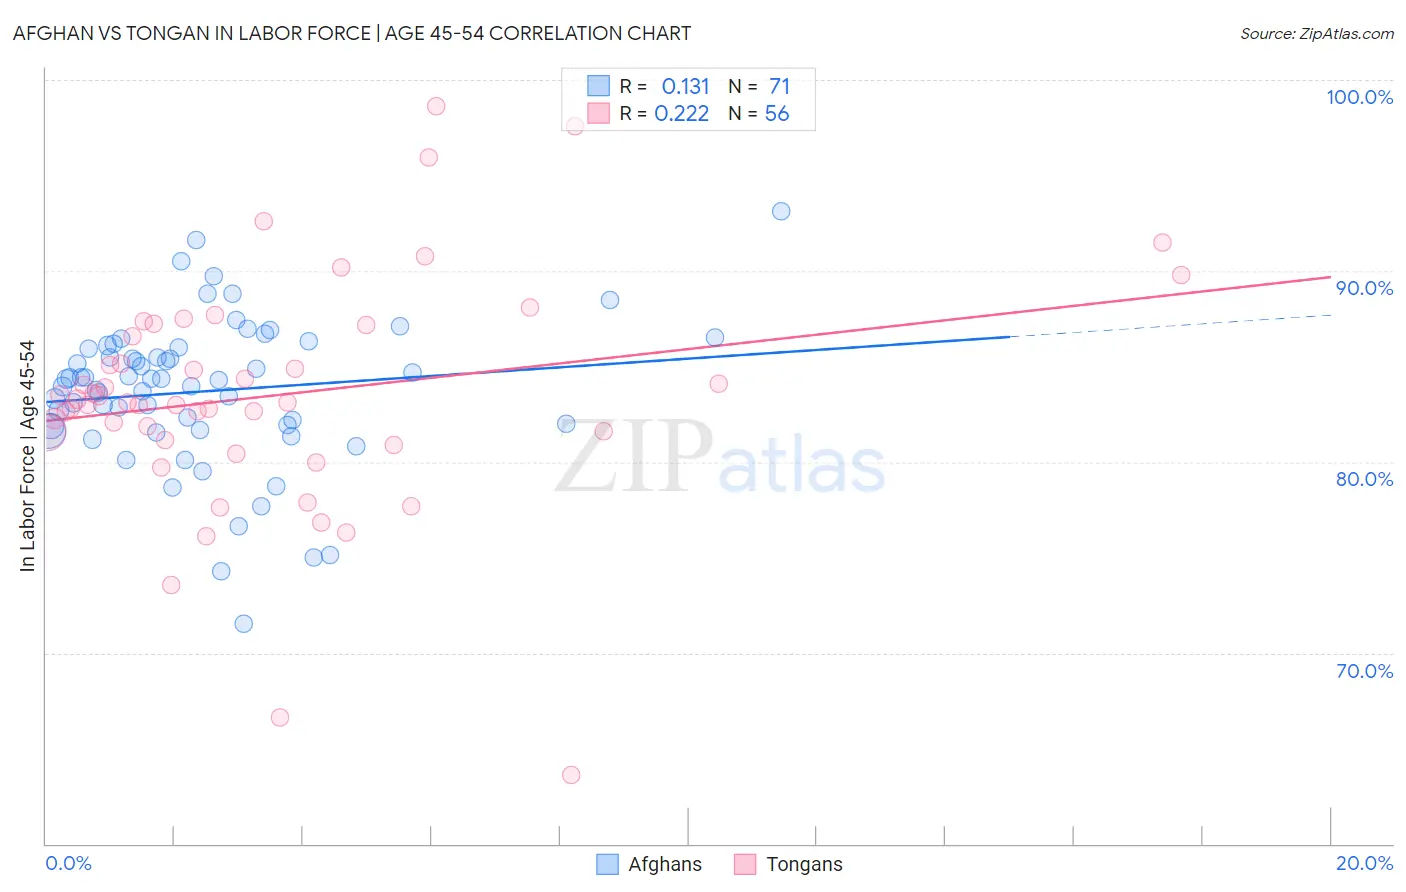
Afghan vs Tongan In Labor Force | Age 45-54 Correlation Chart
The statistical analysis conducted on geographies consisting of 148,803,008 people shows a poor positive correlation between the proportion of Afghans and labor force participation rate among population between the ages 45 and 54 in the United States with a correlation coefficient (R) of 0.131 and weighted average of 83.5%. Similarly, the statistical analysis conducted on geographies consisting of 102,866,719 people shows a weak positive correlation between the proportion of Tongans and labor force participation rate among population between the ages 45 and 54 in the United States with a correlation coefficient (R) of 0.222 and weighted average of 83.1%, a difference of 0.40%.
In Labor Force | Age 45-54 Correlation Summary
| Measurement | Afghan | Tongan |
| Minimum | 71.5% | 63.6% |
| Maximum | 93.1% | 98.6% |
| Range | 21.6% | 35.0% |
| Mean | 83.7% | 83.5% |
| Median | 84.3% | 83.1% |
| Interquartile 25% (IQ1) | 81.9% | 81.3% |
| Interquartile 75% (IQ3) | 86.0% | 86.9% |
| Interquartile Range (IQR) | 4.1% | 5.6% |
| Standard Deviation (Sample) | 3.9% | 6.2% |
| Standard Deviation (Population) | 3.8% | 6.1% |
Similar Demographics by In Labor Force | Age 45-54
Demographics Similar to Afghans by In Labor Force | Age 45-54
In terms of in labor force | age 45-54, the demographic groups most similar to Afghans are Immigrants from Kenya (83.5%, a difference of 0.0%), Immigrants from Taiwan (83.5%, a difference of 0.010%), Egyptian (83.5%, a difference of 0.010%), Asian (83.4%, a difference of 0.020%), and Chilean (83.4%, a difference of 0.020%).
| Demographics | Rating | Rank | In Labor Force | Age 45-54 |
| Immigrants | Peru | 98.6 /100 | #56 | Exceptional 83.5% |
| Paraguayans | 98.5 /100 | #57 | Exceptional 83.5% |
| Eastern Europeans | 98.5 /100 | #58 | Exceptional 83.5% |
| Bhutanese | 98.3 /100 | #59 | Exceptional 83.5% |
| Carpatho Rusyns | 98.3 /100 | #60 | Exceptional 83.5% |
| Filipinos | 98.3 /100 | #61 | Exceptional 83.5% |
| Immigrants | Taiwan | 98.0 /100 | #62 | Exceptional 83.5% |
| Afghans | 97.9 /100 | #63 | Exceptional 83.5% |
| Immigrants | Kenya | 97.9 /100 | #64 | Exceptional 83.5% |
| Egyptians | 97.9 /100 | #65 | Exceptional 83.5% |
| Asians | 97.7 /100 | #66 | Exceptional 83.4% |
| Chileans | 97.7 /100 | #67 | Exceptional 83.4% |
| Immigrants | Colombia | 97.6 /100 | #68 | Exceptional 83.4% |
| Taiwanese | 97.5 /100 | #69 | Exceptional 83.4% |
| Immigrants | Latvia | 97.4 /100 | #70 | Exceptional 83.4% |
Demographics Similar to Tongans by In Labor Force | Age 45-54
In terms of in labor force | age 45-54, the demographic groups most similar to Tongans are Bermudan (83.1%, a difference of 0.0%), Immigrants from Vietnam (83.1%, a difference of 0.010%), Uruguayan (83.1%, a difference of 0.020%), Immigrants from Iran (83.1%, a difference of 0.020%), and Immigrants from Uruguay (83.2%, a difference of 0.040%).
| Demographics | Rating | Rank | In Labor Force | Age 45-54 |
| Immigrants | Malaysia | 91.4 /100 | #116 | Exceptional 83.2% |
| Immigrants | China | 90.9 /100 | #117 | Exceptional 83.2% |
| Immigrants | Europe | 90.7 /100 | #118 | Exceptional 83.2% |
| Immigrants | Uruguay | 90.2 /100 | #119 | Exceptional 83.2% |
| Immigrants | Russia | 90.1 /100 | #120 | Exceptional 83.2% |
| Uruguayans | 89.4 /100 | #121 | Excellent 83.1% |
| Immigrants | Vietnam | 88.9 /100 | #122 | Excellent 83.1% |
| Tongans | 88.2 /100 | #123 | Excellent 83.1% |
| Bermudans | 88.0 /100 | #124 | Excellent 83.1% |
| Immigrants | Iran | 87.2 /100 | #125 | Excellent 83.1% |
| Immigrants | Belgium | 86.4 /100 | #126 | Excellent 83.1% |
| Immigrants | Jordan | 85.2 /100 | #127 | Excellent 83.1% |
| Germans | 85.1 /100 | #128 | Excellent 83.1% |
| Immigrants | Northern Europe | 85.1 /100 | #129 | Excellent 83.1% |
| Immigrants | Israel | 84.7 /100 | #130 | Excellent 83.1% |