Immigrants from Singapore vs Tongan In Labor Force | Age 20-24
COMPARE
Immigrants from Singapore
Tongan
In Labor Force | Age 20-24
In Labor Force | Age 20-24 Comparison
Immigrants from Singapore
Tongans
72.4%
IN LABOR FORCE | AGE 20-24
0.0/ 100
METRIC RATING
305th/ 347
METRIC RANK
77.9%
IN LABOR FORCE | AGE 20-24
100.0/ 100
METRIC RATING
26th/ 347
METRIC RANK
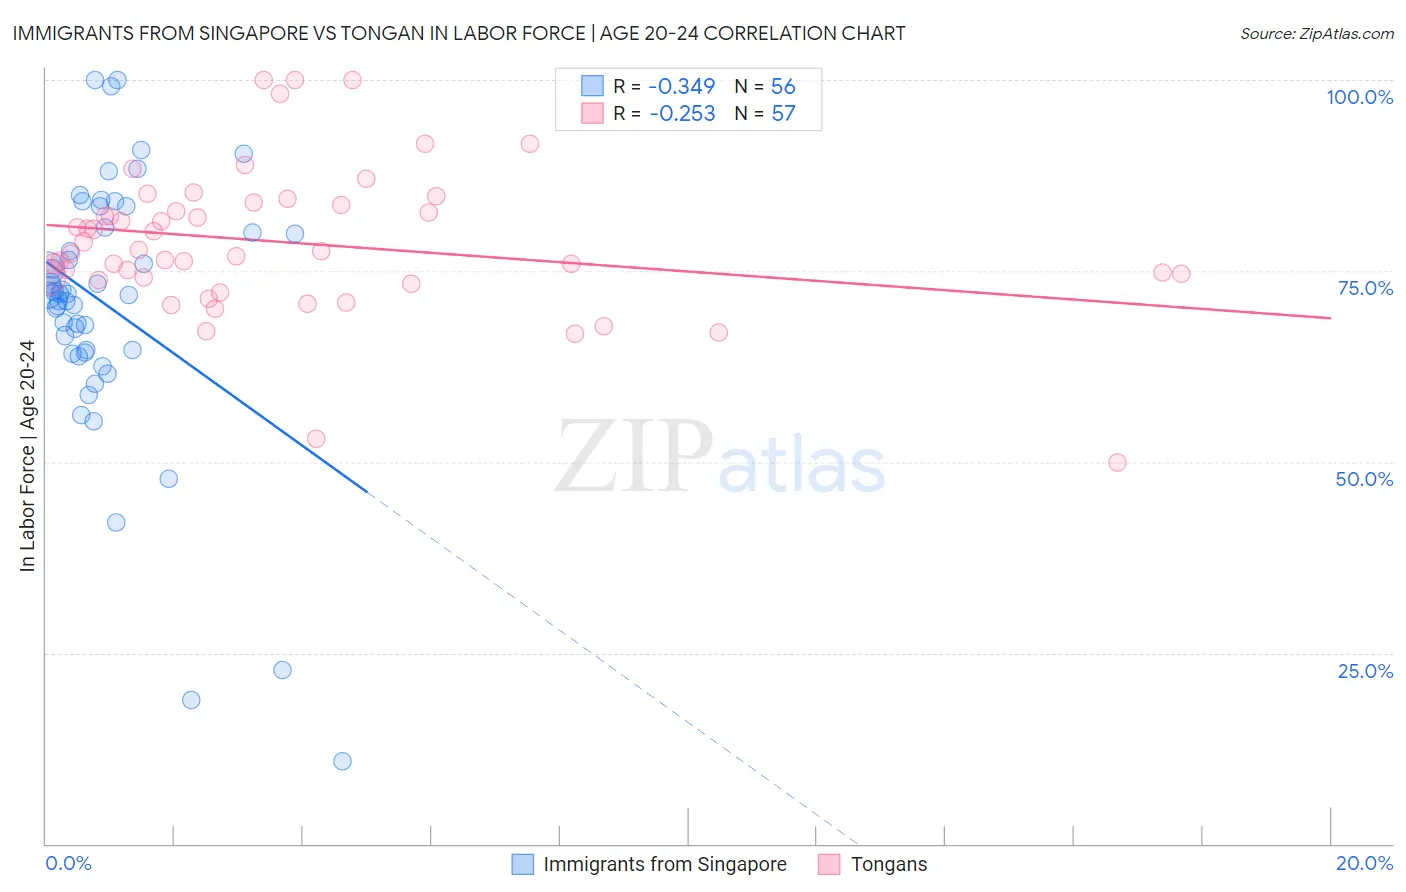
Immigrants from Singapore vs Tongan In Labor Force | Age 20-24 Correlation Chart
The statistical analysis conducted on geographies consisting of 137,517,565 people shows a mild negative correlation between the proportion of Immigrants from Singapore and labor force participation rate among population between the ages 20 and 24 in the United States with a correlation coefficient (R) of -0.349 and weighted average of 72.4%. Similarly, the statistical analysis conducted on geographies consisting of 102,904,168 people shows a weak negative correlation between the proportion of Tongans and labor force participation rate among population between the ages 20 and 24 in the United States with a correlation coefficient (R) of -0.253 and weighted average of 77.9%, a difference of 7.6%.
In Labor Force | Age 20-24 Correlation Summary
| Measurement | Immigrants from Singapore | Tongan |
| Minimum | 10.8% | 50.0% |
| Maximum | 100.0% | 100.0% |
| Range | 89.2% | 50.0% |
| Mean | 70.4% | 78.7% |
| Median | 71.9% | 77.6% |
| Interquartile 25% (IQ1) | 64.5% | 74.0% |
| Interquartile 75% (IQ3) | 80.3% | 83.8% |
| Interquartile Range (IQR) | 15.9% | 9.8% |
| Standard Deviation (Sample) | 17.3% | 9.7% |
| Standard Deviation (Population) | 17.2% | 9.6% |
Similar Demographics by In Labor Force | Age 20-24
Demographics Similar to Immigrants from Singapore by In Labor Force | Age 20-24
In terms of in labor force | age 20-24, the demographic groups most similar to Immigrants from Singapore are Immigrants from Jamaica (72.4%, a difference of 0.020%), Immigrants from West Indies (72.4%, a difference of 0.030%), Ecuadorian (72.4%, a difference of 0.040%), Native/Alaskan (72.4%, a difference of 0.050%), and Cuban (72.5%, a difference of 0.14%).
| Demographics | Rating | Rank | In Labor Force | Age 20-24 |
| Israelis | 0.0 /100 | #298 | Tragic 72.6% |
| Iranians | 0.0 /100 | #299 | Tragic 72.6% |
| Armenians | 0.0 /100 | #300 | Tragic 72.5% |
| Cubans | 0.0 /100 | #301 | Tragic 72.5% |
| Natives/Alaskans | 0.0 /100 | #302 | Tragic 72.4% |
| Ecuadorians | 0.0 /100 | #303 | Tragic 72.4% |
| Immigrants | West Indies | 0.0 /100 | #304 | Tragic 72.4% |
| Immigrants | Singapore | 0.0 /100 | #305 | Tragic 72.4% |
| Immigrants | Jamaica | 0.0 /100 | #306 | Tragic 72.4% |
| Immigrants | Ecuador | 0.0 /100 | #307 | Tragic 72.3% |
| Soviet Union | 0.0 /100 | #308 | Tragic 72.3% |
| Tsimshian | 0.0 /100 | #309 | Tragic 72.3% |
| Immigrants | Cuba | 0.0 /100 | #310 | Tragic 72.0% |
| Apache | 0.0 /100 | #311 | Tragic 72.0% |
| Immigrants | Caribbean | 0.0 /100 | #312 | Tragic 71.9% |
Demographics Similar to Tongans by In Labor Force | Age 20-24
In terms of in labor force | age 20-24, the demographic groups most similar to Tongans are Tlingit-Haida (77.9%, a difference of 0.020%), Yugoslavian (78.0%, a difference of 0.060%), Liberian (78.0%, a difference of 0.060%), Pennsylvania German (78.0%, a difference of 0.070%), and Immigrants from Micronesia (77.8%, a difference of 0.12%).
| Demographics | Rating | Rank | In Labor Force | Age 20-24 |
| Bangladeshis | 100.0 /100 | #19 | Exceptional 78.1% |
| French Canadians | 100.0 /100 | #20 | Exceptional 78.1% |
| Puget Sound Salish | 100.0 /100 | #21 | Exceptional 78.0% |
| Pennsylvania Germans | 100.0 /100 | #22 | Exceptional 78.0% |
| Yugoslavians | 100.0 /100 | #23 | Exceptional 78.0% |
| Liberians | 100.0 /100 | #24 | Exceptional 78.0% |
| Tlingit-Haida | 100.0 /100 | #25 | Exceptional 77.9% |
| Tongans | 100.0 /100 | #26 | Exceptional 77.9% |
| Immigrants | Micronesia | 100.0 /100 | #27 | Exceptional 77.8% |
| Belgians | 100.0 /100 | #28 | Exceptional 77.8% |
| Slovaks | 100.0 /100 | #29 | Exceptional 77.7% |
| Swiss | 100.0 /100 | #30 | Exceptional 77.7% |
| Poles | 100.0 /100 | #31 | Exceptional 77.6% |
| English | 100.0 /100 | #32 | Exceptional 77.6% |
| Immigrants | Ethiopia | 100.0 /100 | #33 | Exceptional 77.5% |