Afghan vs Alaskan Athabascan In Labor Force | Age > 16
COMPARE
Afghan
Alaskan Athabascan
In Labor Force | Age > 16
In Labor Force | Age > 16 Comparison
Afghans
Alaskan Athabascans
67.1%
IN LABOR FORCE | AGE > 16
100.0/ 100
METRIC RATING
33rd/ 347
METRIC RANK
64.8%
IN LABOR FORCE | AGE > 16
13.9/ 100
METRIC RATING
212th/ 347
METRIC RANK
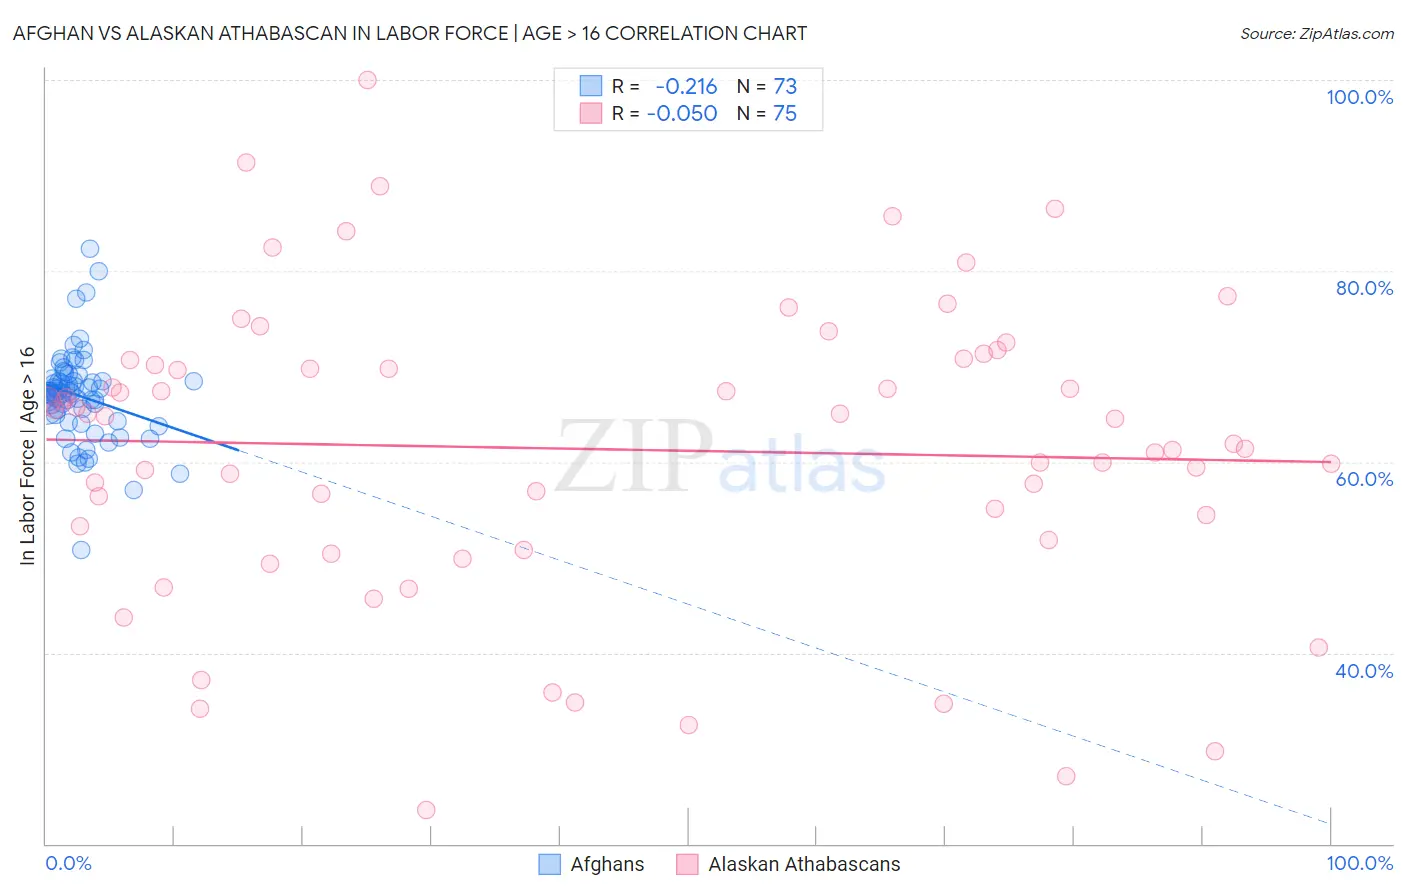
Afghan vs Alaskan Athabascan In Labor Force | Age > 16 Correlation Chart
The statistical analysis conducted on geographies consisting of 148,872,277 people shows a weak negative correlation between the proportion of Afghans and labor force participation rate among population ages 16 and over in the United States with a correlation coefficient (R) of -0.216 and weighted average of 67.1%. Similarly, the statistical analysis conducted on geographies consisting of 45,821,503 people shows no correlation between the proportion of Alaskan Athabascans and labor force participation rate among population ages 16 and over in the United States with a correlation coefficient (R) of -0.050 and weighted average of 64.8%, a difference of 3.6%.
In Labor Force | Age > 16 Correlation Summary
| Measurement | Afghan | Alaskan Athabascan |
| Minimum | 50.8% | 23.6% |
| Maximum | 82.3% | 100.0% |
| Range | 31.5% | 76.4% |
| Mean | 66.9% | 61.3% |
| Median | 67.2% | 64.5% |
| Interquartile 25% (IQ1) | 64.6% | 51.8% |
| Interquartile 75% (IQ3) | 68.6% | 70.6% |
| Interquartile Range (IQR) | 4.0% | 18.8% |
| Standard Deviation (Sample) | 4.8% | 15.7% |
| Standard Deviation (Population) | 4.8% | 15.6% |
Similar Demographics by In Labor Force | Age > 16
Demographics Similar to Afghans by In Labor Force | Age > 16
In terms of in labor force | age > 16, the demographic groups most similar to Afghans are Immigrants from Congo (67.1%, a difference of 0.0%), Immigrants from Ghana (67.1%, a difference of 0.010%), Ghanaian (67.1%, a difference of 0.060%), Immigrants from South Central Asia (67.1%, a difference of 0.070%), and Immigrants from Western Africa (67.1%, a difference of 0.070%).
| Demographics | Rating | Rank | In Labor Force | Age > 16 |
| Immigrants | Cabo Verde | 100.0 /100 | #26 | Exceptional 67.3% |
| Zimbabweans | 100.0 /100 | #27 | Exceptional 67.3% |
| Immigrants | Morocco | 100.0 /100 | #28 | Exceptional 67.2% |
| Thais | 100.0 /100 | #29 | Exceptional 67.2% |
| Immigrants | Zaire | 100.0 /100 | #30 | Exceptional 67.2% |
| Ghanaians | 100.0 /100 | #31 | Exceptional 67.1% |
| Immigrants | Congo | 100.0 /100 | #32 | Exceptional 67.1% |
| Afghans | 100.0 /100 | #33 | Exceptional 67.1% |
| Immigrants | Ghana | 100.0 /100 | #34 | Exceptional 67.1% |
| Immigrants | South Central Asia | 100.0 /100 | #35 | Exceptional 67.1% |
| Immigrants | Western Africa | 100.0 /100 | #36 | Exceptional 67.1% |
| Immigrants | Afghanistan | 100.0 /100 | #37 | Exceptional 67.0% |
| Immigrants | Nigeria | 100.0 /100 | #38 | Exceptional 66.9% |
| Salvadorans | 100.0 /100 | #39 | Exceptional 66.8% |
| Immigrants | El Salvador | 100.0 /100 | #40 | Exceptional 66.8% |
Demographics Similar to Alaskan Athabascans by In Labor Force | Age > 16
In terms of in labor force | age > 16, the demographic groups most similar to Alaskan Athabascans are Maltese (64.8%, a difference of 0.0%), Fijian (64.8%, a difference of 0.010%), Immigrants from Denmark (64.8%, a difference of 0.020%), Estonian (64.8%, a difference of 0.020%), and Immigrants from Trinidad and Tobago (64.8%, a difference of 0.040%).
| Demographics | Rating | Rank | In Labor Force | Age > 16 |
| Jamaicans | 18.7 /100 | #205 | Poor 64.9% |
| Lithuanians | 17.4 /100 | #206 | Poor 64.8% |
| Immigrants | Latin America | 16.4 /100 | #207 | Poor 64.8% |
| Belizeans | 16.2 /100 | #208 | Poor 64.8% |
| Immigrants | Trinidad and Tobago | 15.6 /100 | #209 | Poor 64.8% |
| Immigrants | Denmark | 14.7 /100 | #210 | Poor 64.8% |
| Fijians | 14.1 /100 | #211 | Poor 64.8% |
| Alaskan Athabascans | 13.9 /100 | #212 | Poor 64.8% |
| Maltese | 13.8 /100 | #213 | Poor 64.8% |
| Estonians | 13.1 /100 | #214 | Poor 64.8% |
| Immigrants | Czechoslovakia | 12.3 /100 | #215 | Poor 64.8% |
| Belgians | 11.4 /100 | #216 | Poor 64.7% |
| U.S. Virgin Islanders | 11.3 /100 | #217 | Poor 64.7% |
| Alsatians | 10.7 /100 | #218 | Poor 64.7% |
| Immigrants | Central America | 10.5 /100 | #219 | Poor 64.7% |