West Indian vs Alaskan Athabascan In Labor Force | Age > 16
COMPARE
West Indian
Alaskan Athabascan
In Labor Force | Age > 16
In Labor Force | Age > 16 Comparison
West Indians
Alaskan Athabascans
64.5%
IN LABOR FORCE | AGE > 16
3.0/ 100
METRIC RATING
245th/ 347
METRIC RANK
64.8%
IN LABOR FORCE | AGE > 16
13.9/ 100
METRIC RATING
212th/ 347
METRIC RANK
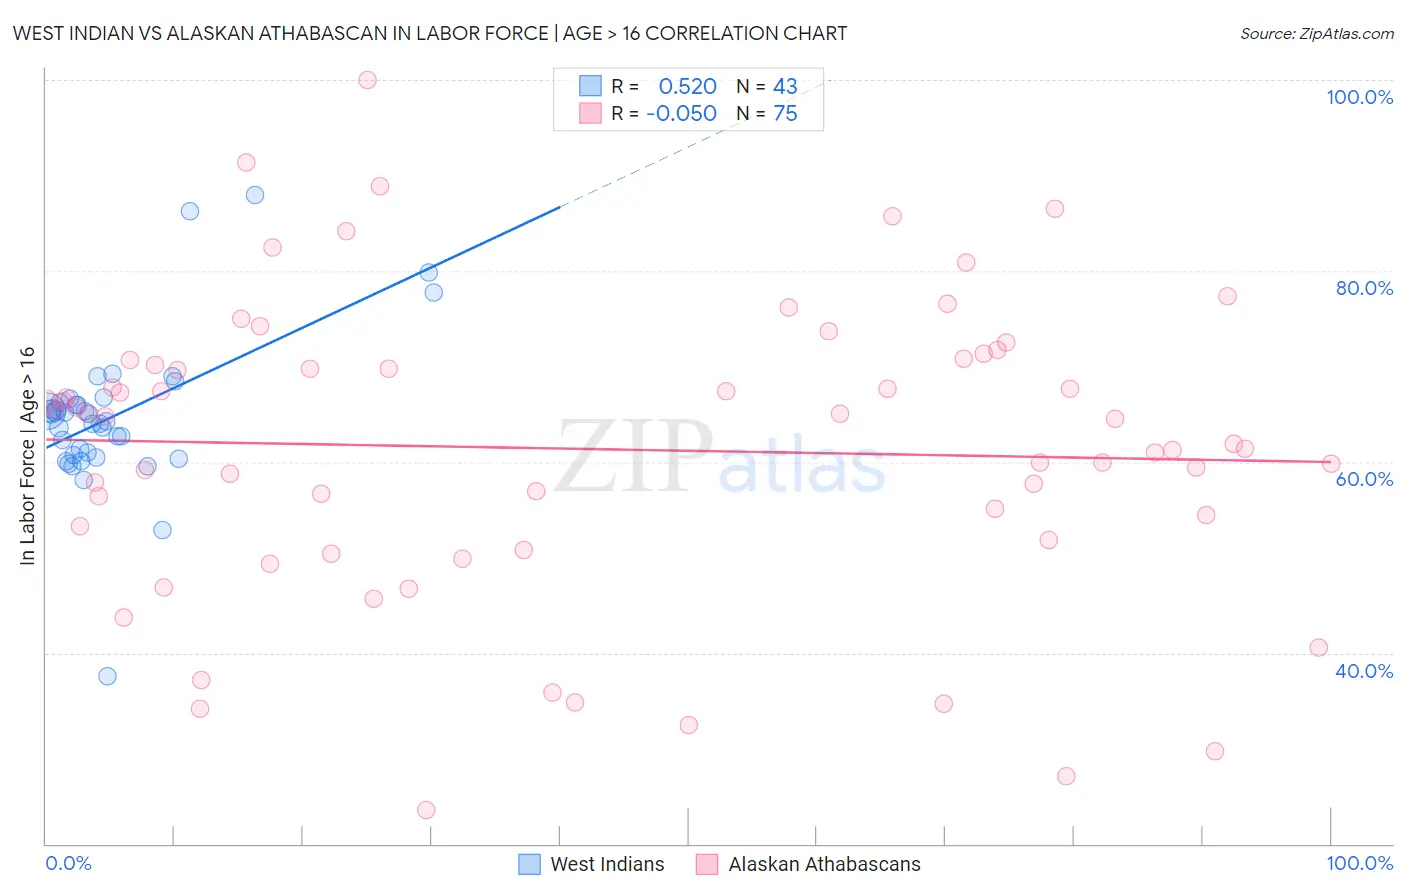
West Indian vs Alaskan Athabascan In Labor Force | Age > 16 Correlation Chart
The statistical analysis conducted on geographies consisting of 254,052,877 people shows a substantial positive correlation between the proportion of West Indians and labor force participation rate among population ages 16 and over in the United States with a correlation coefficient (R) of 0.520 and weighted average of 64.5%. Similarly, the statistical analysis conducted on geographies consisting of 45,821,503 people shows no correlation between the proportion of Alaskan Athabascans and labor force participation rate among population ages 16 and over in the United States with a correlation coefficient (R) of -0.050 and weighted average of 64.8%, a difference of 0.46%.
In Labor Force | Age > 16 Correlation Summary
| Measurement | West Indian | Alaskan Athabascan |
| Minimum | 37.5% | 23.6% |
| Maximum | 87.9% | 100.0% |
| Range | 50.4% | 76.4% |
| Mean | 64.8% | 61.3% |
| Median | 65.1% | 64.5% |
| Interquartile 25% (IQ1) | 60.7% | 51.8% |
| Interquartile 75% (IQ3) | 66.2% | 70.6% |
| Interquartile Range (IQR) | 5.5% | 18.8% |
| Standard Deviation (Sample) | 7.9% | 15.7% |
| Standard Deviation (Population) | 7.8% | 15.6% |
Similar Demographics by In Labor Force | Age > 16
Demographics Similar to West Indians by In Labor Force | Age > 16
In terms of in labor force | age > 16, the demographic groups most similar to West Indians are Tsimshian (64.5%, a difference of 0.0%), Immigrants from Lebanon (64.5%, a difference of 0.020%), Immigrants from Netherlands (64.5%, a difference of 0.030%), Immigrants from Dominica (64.5%, a difference of 0.040%), and Immigrants from Bangladesh (64.5%, a difference of 0.050%).
| Demographics | Rating | Rank | In Labor Force | Age > 16 |
| Lebanese | 3.9 /100 | #238 | Tragic 64.5% |
| Immigrants | Hungary | 3.8 /100 | #239 | Tragic 64.5% |
| Immigrants | Bangladesh | 3.6 /100 | #240 | Tragic 64.5% |
| Immigrants | Dominica | 3.5 /100 | #241 | Tragic 64.5% |
| Immigrants | Netherlands | 3.4 /100 | #242 | Tragic 64.5% |
| Immigrants | Lebanon | 3.2 /100 | #243 | Tragic 64.5% |
| Tsimshian | 3.1 /100 | #244 | Tragic 64.5% |
| West Indians | 3.0 /100 | #245 | Tragic 64.5% |
| Immigrants | Caribbean | 2.3 /100 | #246 | Tragic 64.4% |
| Swiss | 2.1 /100 | #247 | Tragic 64.4% |
| Immigrants | Barbados | 2.1 /100 | #248 | Tragic 64.4% |
| Germans | 1.8 /100 | #249 | Tragic 64.4% |
| British West Indians | 1.8 /100 | #250 | Tragic 64.4% |
| Portuguese | 1.6 /100 | #251 | Tragic 64.4% |
| Immigrants | Dominican Republic | 1.5 /100 | #252 | Tragic 64.4% |
Demographics Similar to Alaskan Athabascans by In Labor Force | Age > 16
In terms of in labor force | age > 16, the demographic groups most similar to Alaskan Athabascans are Maltese (64.8%, a difference of 0.0%), Fijian (64.8%, a difference of 0.010%), Immigrants from Denmark (64.8%, a difference of 0.020%), Estonian (64.8%, a difference of 0.020%), and Immigrants from Trinidad and Tobago (64.8%, a difference of 0.040%).
| Demographics | Rating | Rank | In Labor Force | Age > 16 |
| Jamaicans | 18.7 /100 | #205 | Poor 64.9% |
| Lithuanians | 17.4 /100 | #206 | Poor 64.8% |
| Immigrants | Latin America | 16.4 /100 | #207 | Poor 64.8% |
| Belizeans | 16.2 /100 | #208 | Poor 64.8% |
| Immigrants | Trinidad and Tobago | 15.6 /100 | #209 | Poor 64.8% |
| Immigrants | Denmark | 14.7 /100 | #210 | Poor 64.8% |
| Fijians | 14.1 /100 | #211 | Poor 64.8% |
| Alaskan Athabascans | 13.9 /100 | #212 | Poor 64.8% |
| Maltese | 13.8 /100 | #213 | Poor 64.8% |
| Estonians | 13.1 /100 | #214 | Poor 64.8% |
| Immigrants | Czechoslovakia | 12.3 /100 | #215 | Poor 64.8% |
| Belgians | 11.4 /100 | #216 | Poor 64.7% |
| U.S. Virgin Islanders | 11.3 /100 | #217 | Poor 64.7% |
| Alsatians | 10.7 /100 | #218 | Poor 64.7% |
| Immigrants | Central America | 10.5 /100 | #219 | Poor 64.7% |