Afghan vs Alaskan Athabascan Child Poverty Under the Age of 5
COMPARE
Afghan
Alaskan Athabascan
Child Poverty Under the Age of 5
Child Poverty Under the Age of 5 Comparison
Afghans
Alaskan Athabascans
16.8%
CHILD POVERTY UNDER THE AGE OF 5
74.4/ 100
METRIC RATING
156th/ 347
METRIC RANK
21.8%
CHILD POVERTY UNDER THE AGE OF 5
0.0/ 100
METRIC RATING
300th/ 347
METRIC RANK
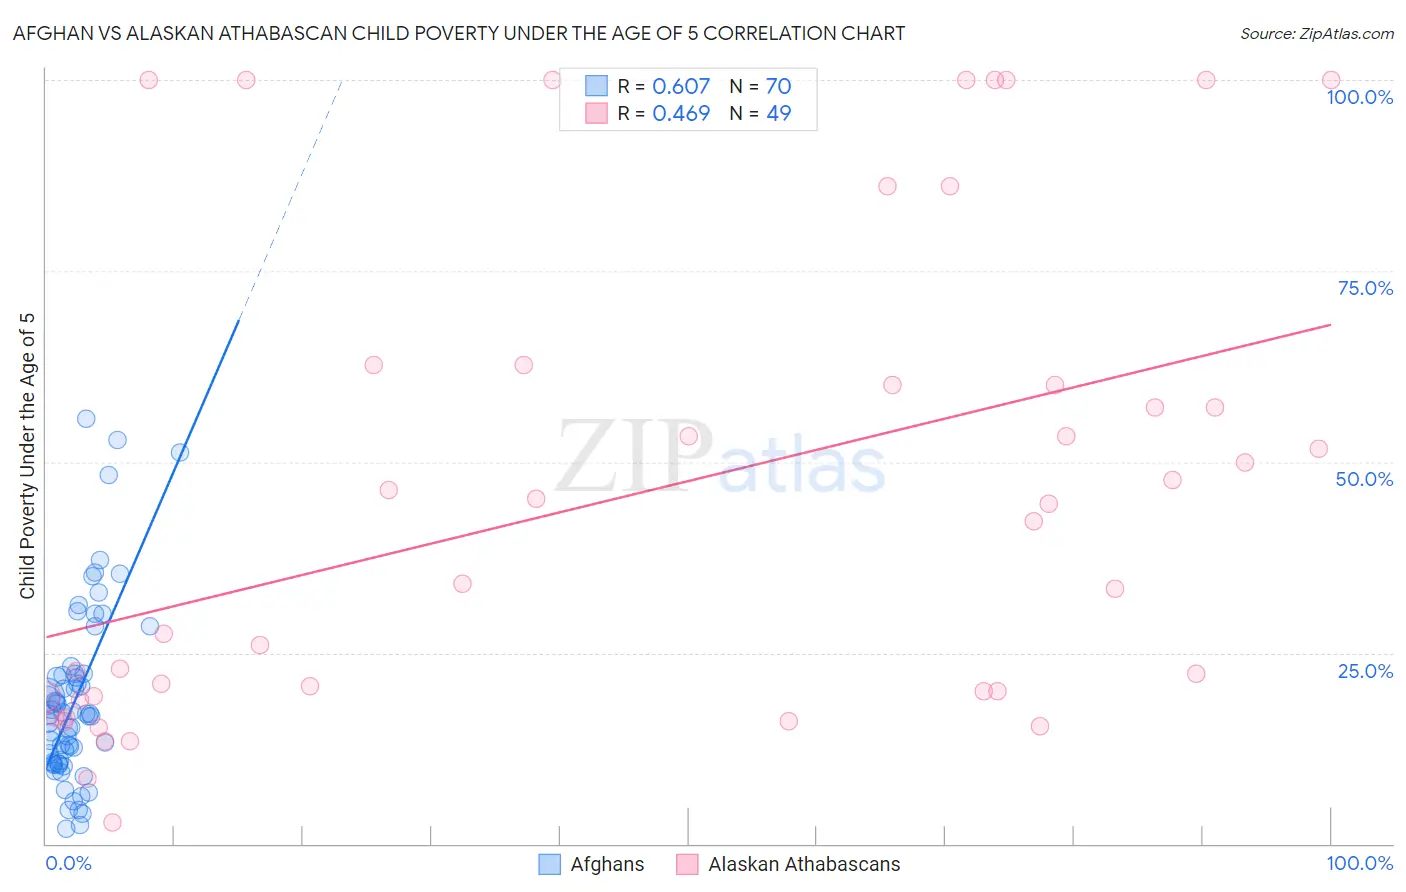
Afghan vs Alaskan Athabascan Child Poverty Under the Age of 5 Correlation Chart
The statistical analysis conducted on geographies consisting of 146,489,297 people shows a significant positive correlation between the proportion of Afghans and poverty level among children under the age of 5 in the United States with a correlation coefficient (R) of 0.607 and weighted average of 16.8%. Similarly, the statistical analysis conducted on geographies consisting of 45,439,676 people shows a moderate positive correlation between the proportion of Alaskan Athabascans and poverty level among children under the age of 5 in the United States with a correlation coefficient (R) of 0.469 and weighted average of 21.8%, a difference of 30.2%.
Child Poverty Under the Age of 5 Correlation Summary
| Measurement | Afghan | Alaskan Athabascan |
| Minimum | 2.0% | 2.7% |
| Maximum | 55.6% | 100.0% |
| Range | 53.6% | 97.3% |
| Mean | 19.0% | 45.5% |
| Median | 16.9% | 42.3% |
| Interquartile 25% (IQ1) | 10.6% | 19.3% |
| Interquartile 75% (IQ3) | 22.2% | 61.3% |
| Interquartile Range (IQR) | 11.6% | 42.0% |
| Standard Deviation (Sample) | 11.8% | 31.0% |
| Standard Deviation (Population) | 11.7% | 30.7% |
Similar Demographics by Child Poverty Under the Age of 5
Demographics Similar to Afghans by Child Poverty Under the Age of 5
In terms of child poverty under the age of 5, the demographic groups most similar to Afghans are Venezuelan (16.8%, a difference of 0.090%), South American (16.7%, a difference of 0.10%), Immigrants from Venezuela (16.7%, a difference of 0.23%), Czechoslovakian (16.8%, a difference of 0.26%), and Immigrants from Syria (16.8%, a difference of 0.29%).
| Demographics | Rating | Rank | Child Poverty Under the Age of 5 |
| New Zealanders | 78.7 /100 | #149 | Good 16.6% |
| Colombians | 77.8 /100 | #150 | Good 16.7% |
| Canadians | 77.6 /100 | #151 | Good 16.7% |
| Belgians | 77.2 /100 | #152 | Good 16.7% |
| Dutch | 77.1 /100 | #153 | Good 16.7% |
| Immigrants | Venezuela | 76.0 /100 | #154 | Good 16.7% |
| South Americans | 75.1 /100 | #155 | Good 16.7% |
| Afghans | 74.4 /100 | #156 | Good 16.8% |
| Venezuelans | 73.7 /100 | #157 | Good 16.8% |
| Czechoslovakians | 72.5 /100 | #158 | Good 16.8% |
| Immigrants | Syria | 72.3 /100 | #159 | Good 16.8% |
| Irish | 72.0 /100 | #160 | Good 16.8% |
| English | 70.4 /100 | #161 | Good 16.8% |
| Costa Ricans | 69.8 /100 | #162 | Good 16.9% |
| Scottish | 68.6 /100 | #163 | Good 16.9% |
Demographics Similar to Alaskan Athabascans by Child Poverty Under the Age of 5
In terms of child poverty under the age of 5, the demographic groups most similar to Alaskan Athabascans are Blackfeet (21.8%, a difference of 0.010%), Chickasaw (21.8%, a difference of 0.010%), Hispanic or Latino (21.7%, a difference of 0.40%), Yaqui (21.7%, a difference of 0.41%), and Cherokee (21.7%, a difference of 0.57%).
| Demographics | Rating | Rank | Child Poverty Under the Age of 5 |
| Mexicans | 0.0 /100 | #293 | Tragic 21.6% |
| Guatemalans | 0.0 /100 | #294 | Tragic 21.6% |
| Cherokee | 0.0 /100 | #295 | Tragic 21.7% |
| Yaqui | 0.0 /100 | #296 | Tragic 21.7% |
| Hispanics or Latinos | 0.0 /100 | #297 | Tragic 21.7% |
| Blackfeet | 0.0 /100 | #298 | Tragic 21.8% |
| Chickasaw | 0.0 /100 | #299 | Tragic 21.8% |
| Alaskan Athabascans | 0.0 /100 | #300 | Tragic 21.8% |
| Immigrants | Central America | 0.0 /100 | #301 | Tragic 22.0% |
| Iroquois | 0.0 /100 | #302 | Tragic 22.0% |
| Inupiat | 0.0 /100 | #303 | Tragic 22.0% |
| Immigrants | Guatemala | 0.0 /100 | #304 | Tragic 22.0% |
| Immigrants | Mexico | 0.0 /100 | #305 | Tragic 22.2% |
| Indonesians | 0.0 /100 | #306 | Tragic 22.3% |
| Immigrants | Bahamas | 0.0 /100 | #307 | Tragic 22.7% |