Afghan vs Seminole In Labor Force | Age > 16
COMPARE
Afghan
Seminole
In Labor Force | Age > 16
In Labor Force | Age > 16 Comparison
Afghans
Seminole
67.1%
IN LABOR FORCE | AGE > 16
100.0/ 100
METRIC RATING
33rd/ 347
METRIC RANK
62.0%
IN LABOR FORCE | AGE > 16
0.0/ 100
METRIC RATING
323rd/ 347
METRIC RANK
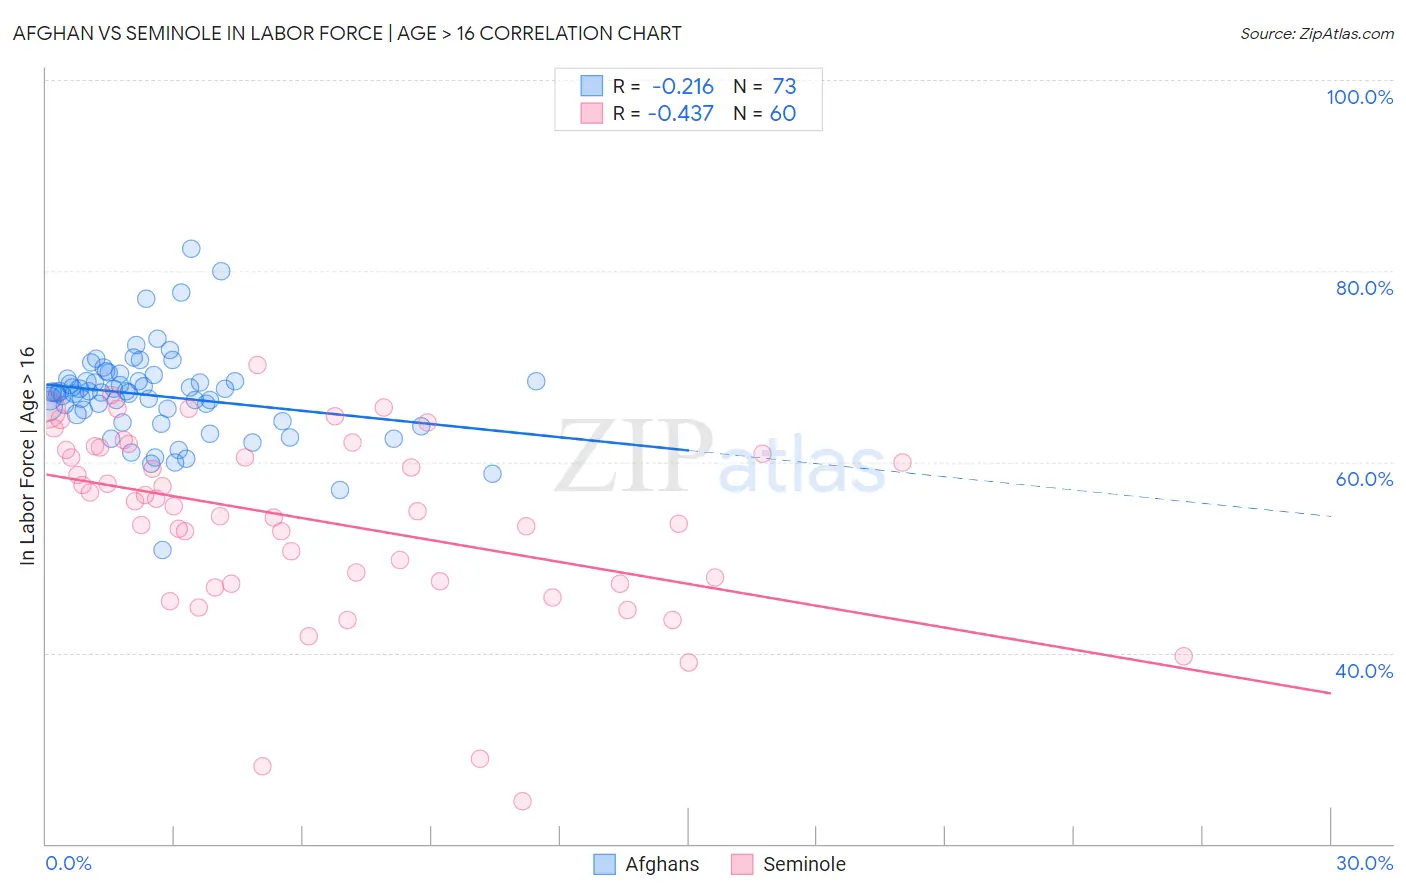
Afghan vs Seminole In Labor Force | Age > 16 Correlation Chart
The statistical analysis conducted on geographies consisting of 148,872,277 people shows a weak negative correlation between the proportion of Afghans and labor force participation rate among population ages 16 and over in the United States with a correlation coefficient (R) of -0.216 and weighted average of 67.1%. Similarly, the statistical analysis conducted on geographies consisting of 118,310,187 people shows a moderate negative correlation between the proportion of Seminole and labor force participation rate among population ages 16 and over in the United States with a correlation coefficient (R) of -0.437 and weighted average of 62.0%, a difference of 8.2%.
In Labor Force | Age > 16 Correlation Summary
| Measurement | Afghan | Seminole |
| Minimum | 50.8% | 24.4% |
| Maximum | 82.3% | 70.1% |
| Range | 31.5% | 45.7% |
| Mean | 66.9% | 53.9% |
| Median | 67.2% | 55.6% |
| Interquartile 25% (IQ1) | 64.6% | 47.4% |
| Interquartile 75% (IQ3) | 68.6% | 61.4% |
| Interquartile Range (IQR) | 4.0% | 14.1% |
| Standard Deviation (Sample) | 4.8% | 9.8% |
| Standard Deviation (Population) | 4.8% | 9.7% |
Similar Demographics by In Labor Force | Age > 16
Demographics Similar to Afghans by In Labor Force | Age > 16
In terms of in labor force | age > 16, the demographic groups most similar to Afghans are Immigrants from Congo (67.1%, a difference of 0.0%), Immigrants from Ghana (67.1%, a difference of 0.010%), Ghanaian (67.1%, a difference of 0.060%), Immigrants from South Central Asia (67.1%, a difference of 0.070%), and Immigrants from Western Africa (67.1%, a difference of 0.070%).
| Demographics | Rating | Rank | In Labor Force | Age > 16 |
| Immigrants | Cabo Verde | 100.0 /100 | #26 | Exceptional 67.3% |
| Zimbabweans | 100.0 /100 | #27 | Exceptional 67.3% |
| Immigrants | Morocco | 100.0 /100 | #28 | Exceptional 67.2% |
| Thais | 100.0 /100 | #29 | Exceptional 67.2% |
| Immigrants | Zaire | 100.0 /100 | #30 | Exceptional 67.2% |
| Ghanaians | 100.0 /100 | #31 | Exceptional 67.1% |
| Immigrants | Congo | 100.0 /100 | #32 | Exceptional 67.1% |
| Afghans | 100.0 /100 | #33 | Exceptional 67.1% |
| Immigrants | Ghana | 100.0 /100 | #34 | Exceptional 67.1% |
| Immigrants | South Central Asia | 100.0 /100 | #35 | Exceptional 67.1% |
| Immigrants | Western Africa | 100.0 /100 | #36 | Exceptional 67.1% |
| Immigrants | Afghanistan | 100.0 /100 | #37 | Exceptional 67.0% |
| Immigrants | Nigeria | 100.0 /100 | #38 | Exceptional 66.9% |
| Salvadorans | 100.0 /100 | #39 | Exceptional 66.8% |
| Immigrants | El Salvador | 100.0 /100 | #40 | Exceptional 66.8% |
Demographics Similar to Seminole by In Labor Force | Age > 16
In terms of in labor force | age > 16, the demographic groups most similar to Seminole are Ottawa (62.0%, a difference of 0.030%), Cheyenne (62.0%, a difference of 0.040%), Cherokee (61.9%, a difference of 0.090%), American (62.1%, a difference of 0.18%), and Arapaho (62.1%, a difference of 0.22%).
| Demographics | Rating | Rank | In Labor Force | Age > 16 |
| Yup'ik | 0.0 /100 | #316 | Tragic 62.7% |
| Kiowa | 0.0 /100 | #317 | Tragic 62.4% |
| Chickasaw | 0.0 /100 | #318 | Tragic 62.3% |
| Arapaho | 0.0 /100 | #319 | Tragic 62.1% |
| Yakama | 0.0 /100 | #320 | Tragic 62.1% |
| Americans | 0.0 /100 | #321 | Tragic 62.1% |
| Ottawa | 0.0 /100 | #322 | Tragic 62.0% |
| Seminole | 0.0 /100 | #323 | Tragic 62.0% |
| Cheyenne | 0.0 /100 | #324 | Tragic 62.0% |
| Cherokee | 0.0 /100 | #325 | Tragic 61.9% |
| Sioux | 0.0 /100 | #326 | Tragic 61.8% |
| Cajuns | 0.0 /100 | #327 | Tragic 61.8% |
| Dutch West Indians | 0.0 /100 | #328 | Tragic 61.7% |
| Choctaw | 0.0 /100 | #329 | Tragic 61.5% |
| Creek | 0.0 /100 | #330 | Tragic 61.3% |