Zip Codes with the Highest Percentage of Population with a Degree in Engineering in Hammond, LA
RELATED REPORTS & OPTIONS
Engineering
Hammond
Compare Zip Codes
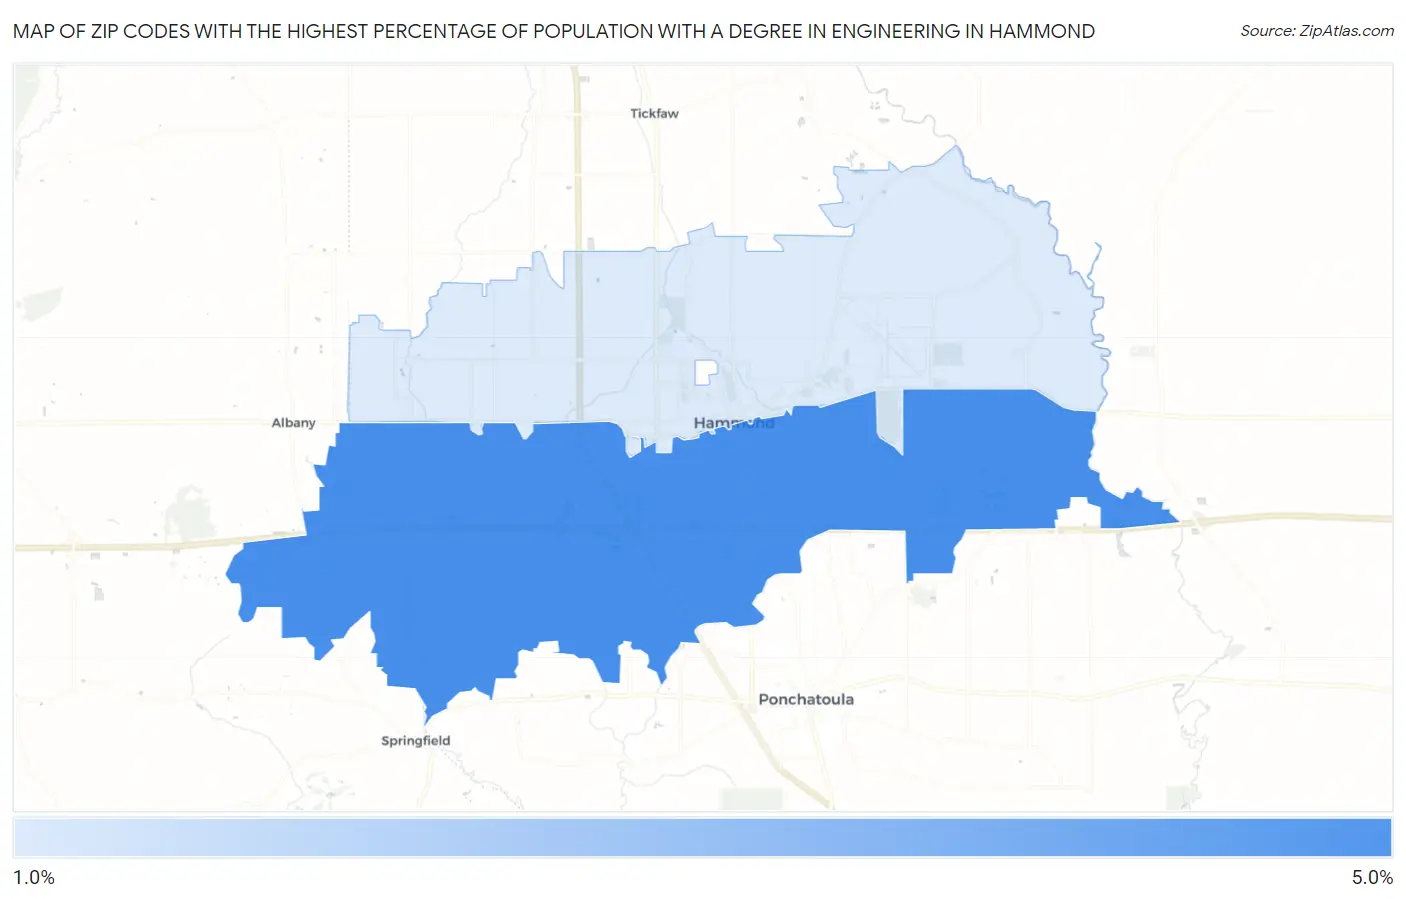
Map of Zip Codes with the Highest Percentage of Population with a Degree in Engineering in Hammond
1.3%
4.1%
Zip Codes with the Highest Percentage of Population with a Degree in Engineering in Hammond, LA
| Zip Code | % Graduates | vs State | vs National | |
| 1. | 70403 | 4.1% | 6.2%(-2.17)#201 | 7.6%(-3.58)#16,165 |
| 2. | 70401 | 1.3% | 6.2%(-4.98)#293 | 7.6%(-6.39)#22,228 |
1
Common Questions
What are the Top Zip Codes with the Highest Percentage of Population with a Degree in Engineering in Hammond, LA?
Top Zip Codes with the Highest Percentage of Population with a Degree in Engineering in Hammond, LA are:
What zip code has the Highest Percentage of Population with a Degree in Engineering in Hammond, LA?
70403 has the Highest Percentage of Population with a Degree in Engineering in Hammond, LA with 4.1%.
What is the Percentage of Population with a Degree in Engineering in Hammond, LA?
Percentage of Population with a Degree in Engineering in Hammond is 2.4%.
What is the Percentage of Population with a Degree in Engineering in Louisiana?
Percentage of Population with a Degree in Engineering in Louisiana is 6.2%.
What is the Percentage of Population with a Degree in Engineering in the United States?
Percentage of Population with a Degree in Engineering in the United States is 7.6%.